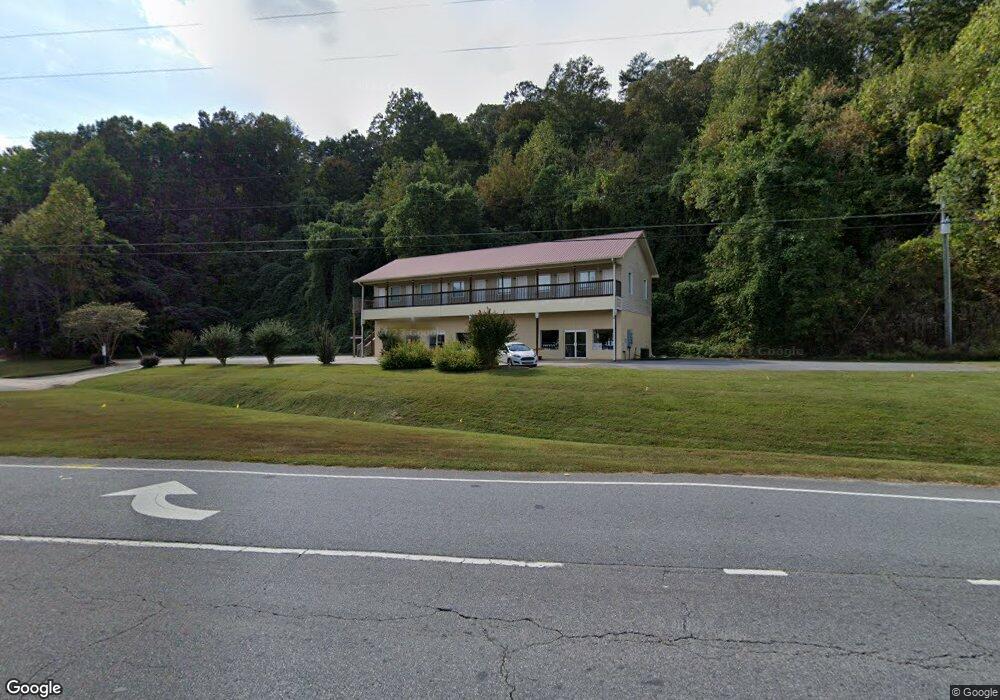
32 Auraria Rd Dahlonega, GA 30533
Estimated Value: $545,362
--
Bed
--
Bath
4,800
Sq Ft
$114/Sq Ft
Est. Value
About This Home
This home is located at 32 Auraria Rd, Dahlonega, GA 30533 and is currently estimated at $545,362, approximately $113 per square foot. 32 Auraria Rd is a home located in Lumpkin County with nearby schools including Clay County Middle School and Lumpkin County High School.
Ownership History
Date
Name
Owned For
Owner Type
Purchase Details
Closed on
Jan 30, 2020
Sold by
Parker And Jane Grp Llc
Bought by
Green Falcon Properties Llc
Current Estimated Value
Purchase Details
Closed on
Nov 29, 2017
Sold by
Abernathy James S
Bought by
Parker
Home Financials for this Owner
Home Financials are based on the most recent Mortgage that was taken out on this home.
Original Mortgage
$310,000
Interest Rate
3.94%
Mortgage Type
New Conventional
Purchase Details
Closed on
Nov 2, 2010
Sold by
Duffy Larry R
Bought by
Abernethy James S
Purchase Details
Closed on
Sep 17, 2004
Sold by
Abernathy James S and Abernathy Susan S
Bought by
Duffy Larry R
Purchase Details
Closed on
Sep 15, 2000
Bought by
Dover Vinson G
Purchase Details
Closed on
Feb 18, 1993
Sold by
Dover Vinson G
Bought by
Abernethy James S
Create a Home Valuation Report for This Property
The Home Valuation Report is an in-depth analysis detailing your home's value as well as a comparison with similar homes in the area
Home Values in the Area
Average Home Value in this Area
Purchase History
| Date | Buyer | Sale Price | Title Company |
|---|---|---|---|
| Green Falcon Properties Llc | $330,000 | -- | |
| Parker | $335,000 | -- | |
| Abernethy James S | -- | -- | |
| Duffy Larry R | $725,000 | -- | |
| Dover Vinson G | -- | -- | |
| Abernethy James S | $51,000 | -- |
Source: Public Records
Mortgage History
| Date | Status | Borrower | Loan Amount |
|---|---|---|---|
| Previous Owner | Parker | $310,000 |
Source: Public Records
Tax History Compared to Growth
Tax History
| Year | Tax Paid | Tax Assessment Tax Assessment Total Assessment is a certain percentage of the fair market value that is determined by local assessors to be the total taxable value of land and additions on the property. | Land | Improvement |
|---|---|---|---|---|
| 2024 | $4,843 | $170,463 | $30,600 | $139,863 |
| 2023 | $4,914 | $170,463 | $30,600 | $139,863 |
| 2022 | $5,255 | $172,026 | $30,600 | $141,426 |
| 2021 | $4,306 | $139,528 | $30,600 | $108,928 |
| 2020 | $4,836 | $142,690 | $30,600 | $112,090 |
| 2019 | $4,860 | $142,690 | $30,600 | $112,090 |
| 2018 | $3,517 | $96,634 | $18,360 | $78,274 |
| 2017 | $3,591 | $97,016 | $18,360 | $78,656 |
| 2016 | $3,670 | $97,016 | $18,360 | $78,656 |
| 2015 | $3,237 | $97,016 | $18,360 | $78,656 |
| 2014 | $3,237 | $100,002 | $18,360 | $81,642 |
| 2013 | -- | $108,679 | $18,360 | $90,319 |
Source: Public Records
Map
Nearby Homes
- 0 Dawsonville Hwy Unit 10631159
- 00 Dawsonville Hwy
- 114 Funaro Ln
- 253 Blair Ridge Rd
- 120 Blair Ridge Rd
- 121 Blair Ridge Rd
- 490 N Hall Rd
- 549 Ivy Terrace
- 1047 Nugget Ct
- 132 J Mountain Dr
- 399 N Chestatee St
- 168 W Main St
- 315 Church St
- 1202 Oak Grove Rd
- 735 Calhoun Rd
- 95 Jones St
- 0 S Chestatee St Unit 10619536
- 99 Madeline Anthony Road Lots 44 and 45
- 99 Madeline Anthony Rd
- 0 Crown Mountain Unit 7682225
- Lot 4 Auraria Ridge
- 5 Auraria Rd
- 3 Auraria Rd
- 4 Auraria Rd
- 2 Auraria Rd
- 1 Auraria Rd
- 6 Auraria Rd
- 0 Torrington Rd
- 0 Torrington Rd Unit 2964288
- 0 Torrington Rd Unit 8136006
- 0 Torrington Rd Unit 8889942
- 7 Auraria Rd
- 8 Auraria Rd
- 0 Auraria Rd Unit 8413526
- 0 Auraria Rd Unit 6039570
- 0 Auraria Rd Unit 5807083
- 0 Auraria Rd Unit 8262938
- 0 Auraria Rd Unit 5904825
- 0 Auraria Rd Unit 2563174
- 0 Auraria Rd Unit 3196958