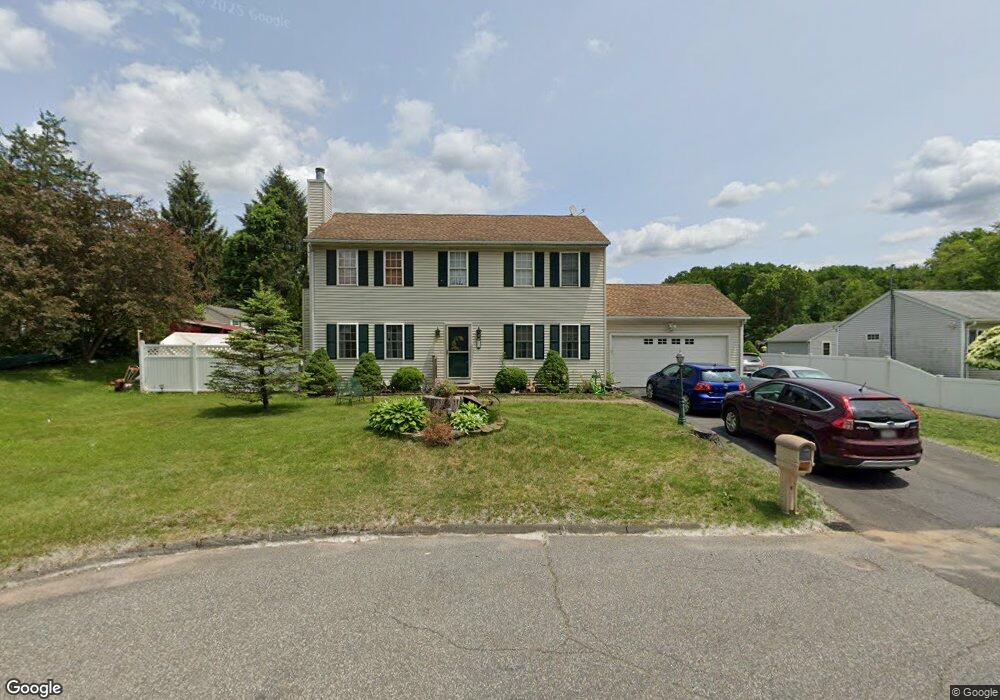
32 Avery St East Longmeadow, MA 01028
Estimated Value: $463,844 - $499,000
3
Beds
2
Baths
1,728
Sq Ft
$281/Sq Ft
Est. Value
About This Home
This home is located at 32 Avery St, East Longmeadow, MA 01028 and is currently estimated at $484,961, approximately $280 per square foot. 32 Avery St is a home located in Hampden County with nearby schools including Meadowbrook Elementary School, Birchland Park Middle School, and East Longmeadow High School.
Ownership History
Date
Name
Owned For
Owner Type
Purchase Details
Closed on
Dec 17, 2002
Sold by
Cooper-Avery Rt and Barbero Joseph
Bought by
Milliken Douglas C and Milliken Deborah J
Current Estimated Value
Home Financials for this Owner
Home Financials are based on the most recent Mortgage that was taken out on this home.
Original Mortgage
$140,000
Outstanding Balance
$59,834
Interest Rate
6.17%
Mortgage Type
Purchase Money Mortgage
Estimated Equity
$425,127
Purchase Details
Closed on
Jun 28, 2002
Sold by
Labare David J
Bought by
Cooper-Avery Rt and Barbero Joseph
Home Financials for this Owner
Home Financials are based on the most recent Mortgage that was taken out on this home.
Original Mortgage
$118,000
Interest Rate
6.92%
Mortgage Type
Purchase Money Mortgage
Create a Home Valuation Report for This Property
The Home Valuation Report is an in-depth analysis detailing your home's value as well as a comparison with similar homes in the area
Home Values in the Area
Average Home Value in this Area
Purchase History
| Date | Buyer | Sale Price | Title Company |
|---|---|---|---|
| Milliken Douglas C | $221,400 | -- | |
| Cooper-Avery Rt | $51,500 | -- |
Source: Public Records
Mortgage History
| Date | Status | Borrower | Loan Amount |
|---|---|---|---|
| Open | Milliken Douglas C | $140,000 | |
| Closed | Milliken Douglas C | $80,000 | |
| Previous Owner | Cooper-Avery Rt | $118,000 |
Source: Public Records
Tax History Compared to Growth
Tax History
| Year | Tax Paid | Tax Assessment Tax Assessment Total Assessment is a certain percentage of the fair market value that is determined by local assessors to be the total taxable value of land and additions on the property. | Land | Improvement |
|---|---|---|---|---|
| 2025 | $7,673 | $415,200 | $117,500 | $297,700 |
| 2024 | $7,275 | $392,400 | $117,500 | $274,900 |
| 2023 | $6,933 | $361,100 | $106,700 | $254,400 |
| 2022 | $6,657 | $328,100 | $96,100 | $232,000 |
| 2021 | $6,556 | $311,300 | $89,000 | $222,300 |
| 2020 | $6,246 | $299,700 | $89,000 | $210,700 |
| 2019 | $5,984 | $291,200 | $86,400 | $204,800 |
| 2018 | $5,823 | $278,100 | $86,400 | $191,700 |
| 2017 | $5,608 | $270,000 | $84,200 | $185,800 |
| 2016 | $5,609 | $265,600 | $81,800 | $183,800 |
| 2015 | $5,503 | $265,600 | $81,800 | $183,800 |
Source: Public Records
Map
Nearby Homes