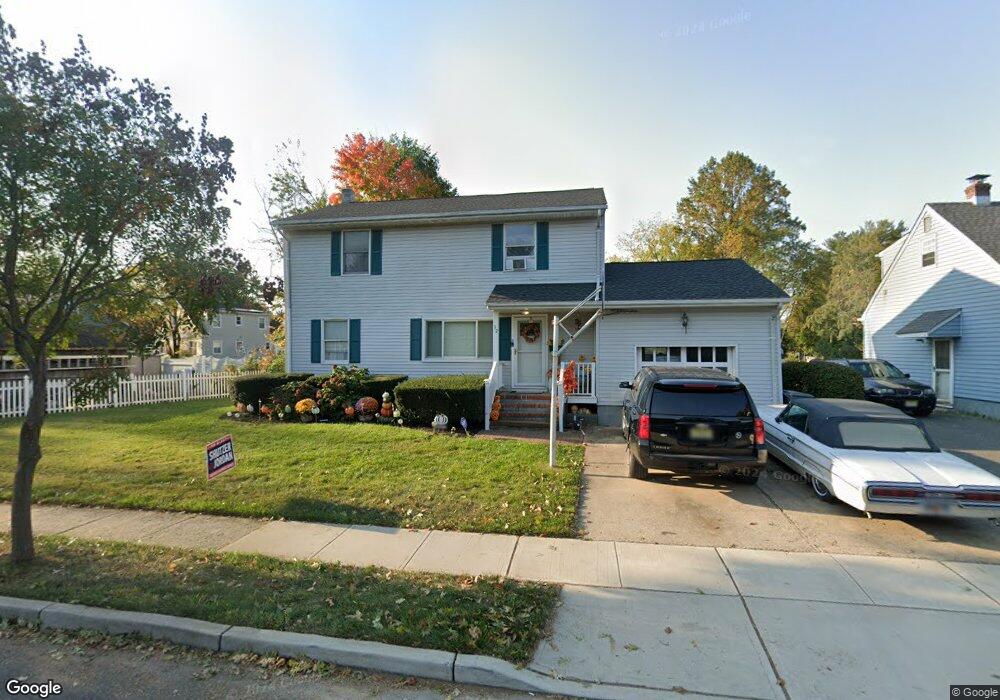
32 Bannard St Freehold, NJ 07728
Estimated Value: $478,000 - $616,000
5
Beds
3
Baths
1,664
Sq Ft
$337/Sq Ft
Est. Value
About This Home
This home is located at 32 Bannard St, Freehold, NJ 07728 and is currently estimated at $560,505, approximately $336 per square foot. 32 Bannard St is a home located in Monmouth County with nearby schools including Park Avenue Elementary School, Freehold Intermediate School, and Freehold Borough High School.
Ownership History
Date
Name
Owned For
Owner Type
Purchase Details
Closed on
May 18, 2022
Sold by
Freeman and Stacey
Bought by
Freeman Juanita D
Current Estimated Value
Home Financials for this Owner
Home Financials are based on the most recent Mortgage that was taken out on this home.
Original Mortgage
$237,077
Outstanding Balance
$224,933
Interest Rate
5.11%
Mortgage Type
FHA
Estimated Equity
$335,572
Purchase Details
Closed on
Jul 29, 1992
Bought by
Sunnerville Stacey and Sunnerville Freeman,Debor
Create a Home Valuation Report for This Property
The Home Valuation Report is an in-depth analysis detailing your home's value as well as a comparison with similar homes in the area
Home Values in the Area
Average Home Value in this Area
Purchase History
| Date | Buyer | Sale Price | Title Company |
|---|---|---|---|
| Freeman Juanita D | -- | New Title Company Name | |
| Freeman Juanita D | -- | Eagle Title Agency Llc | |
| Sunnerville Stacey | $125,000 | -- |
Source: Public Records
Mortgage History
| Date | Status | Borrower | Loan Amount |
|---|---|---|---|
| Open | Freeman Juanita D | $237,077 | |
| Closed | Freeman Juanita D | $237,077 |
Source: Public Records
Tax History Compared to Growth
Tax History
| Year | Tax Paid | Tax Assessment Tax Assessment Total Assessment is a certain percentage of the fair market value that is determined by local assessors to be the total taxable value of land and additions on the property. | Land | Improvement |
|---|---|---|---|---|
| 2025 | $9,897 | $543,800 | $285,900 | $257,900 |
| 2024 | $9,531 | $493,100 | $239,900 | $253,200 |
| 2023 | $9,531 | $454,500 | $207,200 | $247,300 |
| 2022 | $8,517 | $363,200 | $138,000 | $225,200 |
| 2021 | $8,517 | $324,700 | $120,000 | $204,700 |
| 2020 | $8,391 | $315,200 | $120,000 | $195,200 |
| 2019 | $7,931 | $299,300 | $110,000 | $189,300 |
| 2018 | $7,990 | $295,800 | $110,000 | $185,800 |
| 2017 | $7,957 | $293,400 | $110,000 | $183,400 |
| 2016 | $7,386 | $278,200 | $137,400 | $140,800 |
| 2015 | $7,118 | $280,900 | $140,100 | $140,800 |
| 2014 | $6,795 | $280,900 | $140,100 | $140,800 |
Source: Public Records
Map
Nearby Homes