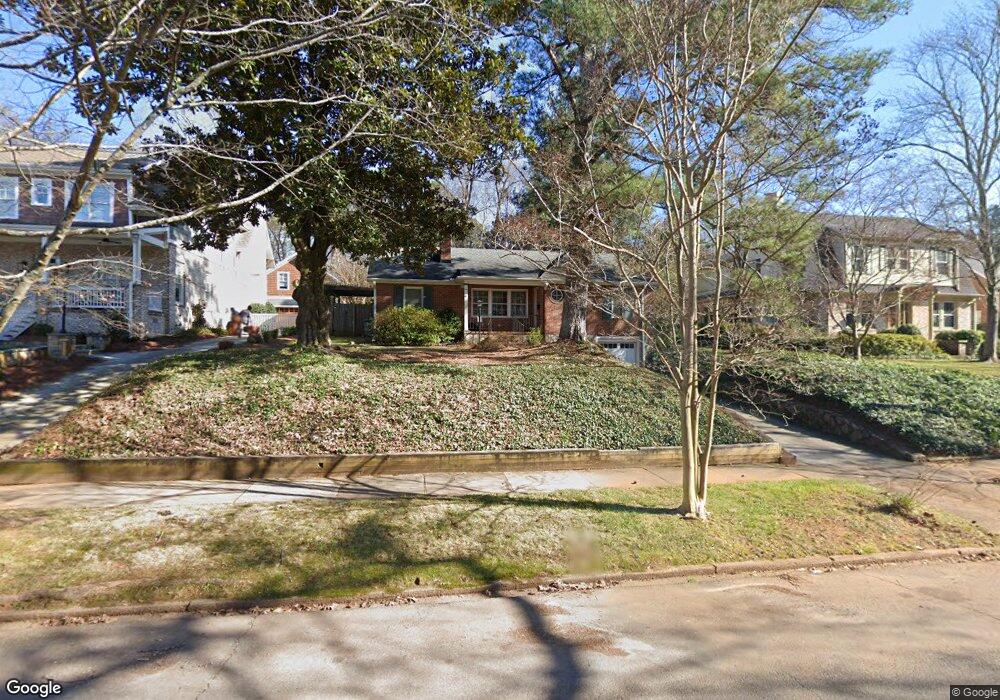
32 Berkeley Rd Avondale Estates, GA 30002
Estimated Value: $553,611 - $719,000
2
Beds
2
Baths
1,720
Sq Ft
$350/Sq Ft
Est. Value
About This Home
This home is located at 32 Berkeley Rd, Avondale Estates, GA 30002 and is currently estimated at $602,653, approximately $350 per square foot. 32 Berkeley Rd is a home located in DeKalb County with nearby schools including Avondale Elementary School, Druid Hills Middle School, and Druid Hills High School.
Ownership History
Date
Name
Owned For
Owner Type
Purchase Details
Closed on
Dec 8, 2025
Sold by
Mcmahan Christine
Bought by
Mcmahan Christine and Zagorski Lawrence A
Current Estimated Value
Purchase Details
Closed on
Dec 4, 2014
Sold by
Mcmahan Christine
Bought by
1526 Iverson Llc
Home Financials for this Owner
Home Financials are based on the most recent Mortgage that was taken out on this home.
Original Mortgage
$240,000
Interest Rate
4.09%
Mortgage Type
New Conventional
Purchase Details
Closed on
Jul 29, 1999
Sold by
Groskowski Bryan P and Groskowski Nancy B
Bought by
Mcmahan Christine
Home Financials for this Owner
Home Financials are based on the most recent Mortgage that was taken out on this home.
Original Mortgage
$170,000
Interest Rate
7.66%
Mortgage Type
New Conventional
Purchase Details
Closed on
Jun 18, 1996
Sold by
Gibney Michael A
Bought by
Grunkowski Bryan P Nancy
Create a Home Valuation Report for This Property
The Home Valuation Report is an in-depth analysis detailing your home's value as well as a comparison with similar homes in the area
Home Values in the Area
Average Home Value in this Area
Purchase History
| Date | Buyer | Sale Price | Title Company |
|---|---|---|---|
| Mcmahan Christine | -- | -- | |
| 1526 Iverson Llc | $240,000 | -- | |
| Mcmahan Christine | $235,000 | -- | |
| Grunkowski Bryan P Nancy | $157,000 | -- |
Source: Public Records
Mortgage History
| Date | Status | Borrower | Loan Amount |
|---|---|---|---|
| Previous Owner | 1526 Iverson Llc | $240,000 | |
| Previous Owner | Mcmahan Christine | $170,000 | |
| Closed | Grunkowski Bryan P Nancy | $0 |
Source: Public Records
Tax History
| Year | Tax Paid | Tax Assessment Tax Assessment Total Assessment is a certain percentage of the fair market value that is determined by local assessors to be the total taxable value of land and additions on the property. | Land | Improvement |
|---|---|---|---|---|
| 2025 | $2,863 | $218,640 | $73,960 | $144,680 |
| 2024 | $2,889 | $218,640 | $73,960 | $144,680 |
| 2023 | $2,889 | $140,640 | $66,101 | $74,539 |
| 2022 | $2,390 | $140,640 | $66,101 | $74,539 |
| 2021 | $2,132 | $140,640 | $66,000 | $74,640 |
| 2020 | $2,010 | $115,600 | $25,432 | $90,168 |
| 2019 | $1,939 | $115,600 | $25,432 | $90,168 |
| 2018 | $3,390 | $138,120 | $30,120 | $108,000 |
| 2017 | $2,092 | $96,000 | $29,760 | $66,240 |
| 2016 | $4,056 | $96,000 | $30,120 | $65,880 |
| 2014 | $3,739 | $88,560 | $62,320 | $26,240 |
Source: Public Records
Map
Nearby Homes
- 9 Kingstone Rd
- 41 Clarendon Ave
- 30 Lakeshore Dr Unit 2
- 64 Clarendon Ave
- 2841 Royal Bluff
- 953 Forrest Blvd
- 1002 Forrest Blvd
- 762 Livingston Place
- 762 Livingstone Place
- 783 Livingstone Place
- 3029 Charlbury Place
- 213 Ohm Ave
- 7 Reese Way
- 85 Devon Ln Unit 85
- 1067 Hess Dr
- 24 Hampshire Ct
- 1044 N Carter Rd
- 264 1st Ave
- 23 Chelsea Ct
- 1149 Dunwick Dr
- 34 Berkeley Rd
- 30 Berkeley Rd
- 28 Berkeley Rd
- 36 Berkeley Rd
- 10 Kingstone Rd
- 26 Berkeley Rd
- 12 Kingstone Rd
- 33 Berkeley Rd
- 35 Berkeley Rd Unit 2
- 31 Berkeley Rd
- 14 Kingstone Rd
- 40 Berkeley Rd
- 37 Berkeley Rd
- 24 Berkeley Rd Unit 1
- 29 Berkeley Rd
- 16 Kingstone Rd
- 11 Kingstone Rd
- 39 Berkeley Rd
- 42 Berkeley Rd
- 25 Berkeley Rd
Your Personal Tour Guide
Ask me questions while you tour the home.