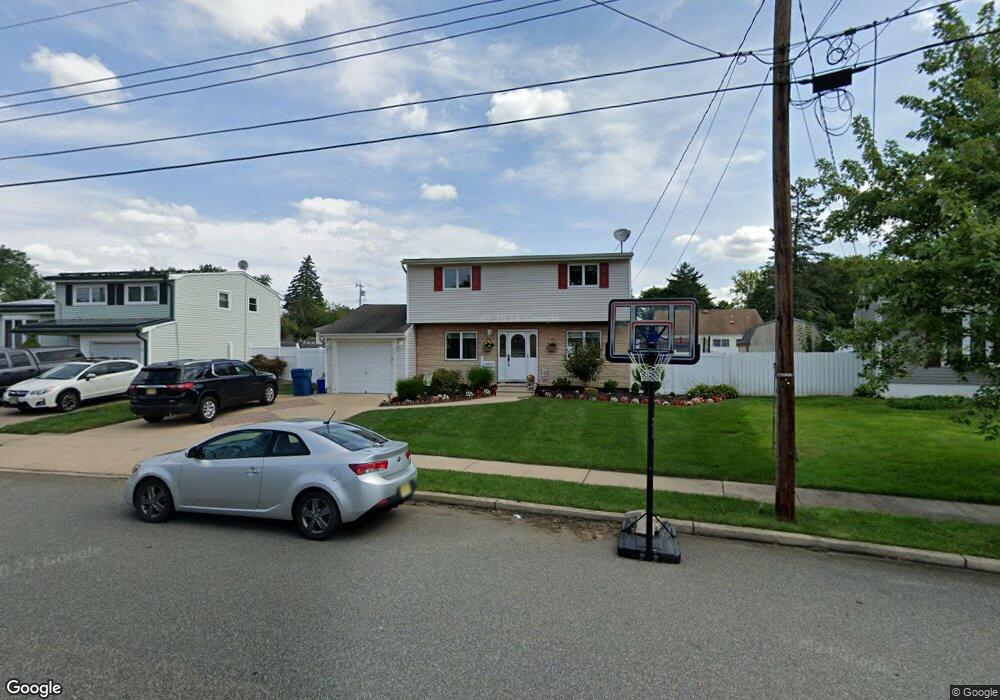
32 Bertrand St Old Bridge, NJ 08857
Estimated Value: $651,000 - $681,000
4
Beds
2
Baths
1,838
Sq Ft
$363/Sq Ft
Est. Value
About This Home
This home is located at 32 Bertrand St, Old Bridge, NJ 08857 and is currently estimated at $666,503, approximately $362 per square foot. 32 Bertrand St is a home located in Middlesex County with nearby schools including Old Bridge High School, St. Ambrose School, and Calvary Christian School.
Ownership History
Date
Name
Owned For
Owner Type
Purchase Details
Closed on
Dec 13, 2023
Sold by
Brower Kimberly
Bought by
Brower Kimberly and Brower Michael
Current Estimated Value
Purchase Details
Closed on
Apr 11, 2007
Sold by
Hojecki James
Bought by
Mcgrath Thomas and Mcgrath Kimberly
Home Financials for this Owner
Home Financials are based on the most recent Mortgage that was taken out on this home.
Original Mortgage
$292,500
Interest Rate
6.19%
Create a Home Valuation Report for This Property
The Home Valuation Report is an in-depth analysis detailing your home's value as well as a comparison with similar homes in the area
Home Values in the Area
Average Home Value in this Area
Purchase History
| Date | Buyer | Sale Price | Title Company |
|---|---|---|---|
| Brower Kimberly | -- | Scott Title Services | |
| Brower Kimberly | -- | Scott Title Services | |
| Mcgrath Thomas | $390,000 | -- |
Source: Public Records
Mortgage History
| Date | Status | Borrower | Loan Amount |
|---|---|---|---|
| Previous Owner | Mcgrath Thomas | $292,500 |
Source: Public Records
Tax History Compared to Growth
Tax History
| Year | Tax Paid | Tax Assessment Tax Assessment Total Assessment is a certain percentage of the fair market value that is determined by local assessors to be the total taxable value of land and additions on the property. | Land | Improvement |
|---|---|---|---|---|
| 2025 | $9,425 | $186,500 | $71,100 | $115,400 |
| 2024 | $9,041 | $166,900 | $71,100 | $95,800 |
| 2023 | $9,041 | $166,900 | $71,100 | $95,800 |
| 2022 | $8,834 | $166,900 | $71,100 | $95,800 |
| 2021 | $6,484 | $166,900 | $71,100 | $95,800 |
| 2020 | $8,574 | $166,900 | $71,100 | $95,800 |
| 2019 | $8,428 | $166,900 | $71,100 | $95,800 |
| 2018 | $8,335 | $166,900 | $71,100 | $95,800 |
| 2017 | $8,065 | $166,900 | $71,100 | $95,800 |
| 2016 | $7,898 | $166,900 | $71,100 | $95,800 |
| 2015 | $7,761 | $149,700 | $71,100 | $78,600 |
| 2014 | $6,891 | $149,700 | $71,100 | $78,600 |
Source: Public Records
Map
Nearby Homes