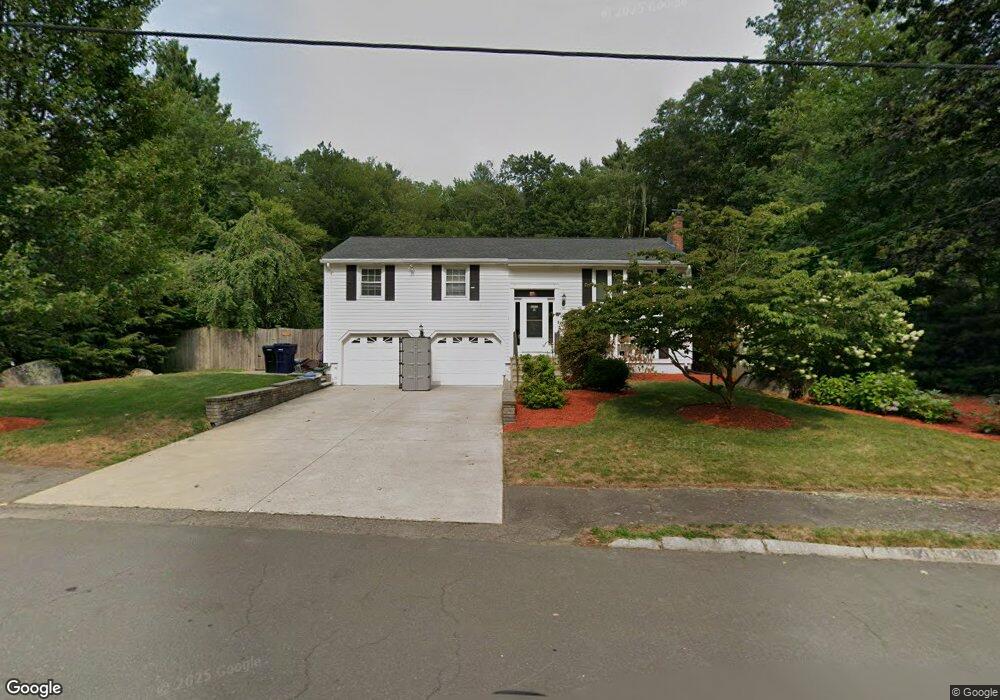
32 Bicknell St Foxboro, MA 02035
Estimated Value: $568,181 - $703,000
3
Beds
2
Baths
1,080
Sq Ft
$586/Sq Ft
Est. Value
About This Home
This home is located at 32 Bicknell St, Foxboro, MA 02035 and is currently estimated at $632,545, approximately $585 per square foot. 32 Bicknell St is a home located in Norfolk County with nearby schools including Foxborough High School, Hands-On-Montessori School, and Cadence Academy Preschool - North Attleborough.
Ownership History
Date
Name
Owned For
Owner Type
Purchase Details
Closed on
Sep 4, 2025
Sold by
Sheehan Joseph P and Sheehan Shannon E
Bought by
Sheehan Joseph P
Current Estimated Value
Purchase Details
Closed on
Feb 19, 2020
Sold by
Sheehan Joseph P
Bought by
Sheehan Joseph P and Sheehan Shannon E
Purchase Details
Closed on
May 30, 2003
Sold by
Bartoloni Stephen A and Bartoloni Patricia A
Bought by
Sheehan Joseph P
Home Financials for this Owner
Home Financials are based on the most recent Mortgage that was taken out on this home.
Original Mortgage
$341,800
Interest Rate
5.86%
Mortgage Type
Purchase Money Mortgage
Create a Home Valuation Report for This Property
The Home Valuation Report is an in-depth analysis detailing your home's value as well as a comparison with similar homes in the area
Home Values in the Area
Average Home Value in this Area
Purchase History
| Date | Buyer | Sale Price | Title Company |
|---|---|---|---|
| Sheehan Joseph P | -- | -- | |
| Sheehan Joseph P | -- | Equity National Title | |
| Sheehan Joseph P | $359,900 | -- | |
| Sheehan Joseph P | $359,900 | -- |
Source: Public Records
Mortgage History
| Date | Status | Borrower | Loan Amount |
|---|---|---|---|
| Previous Owner | Sheehan Joseph P | $341,800 |
Source: Public Records
Tax History Compared to Growth
Tax History
| Year | Tax Paid | Tax Assessment Tax Assessment Total Assessment is a certain percentage of the fair market value that is determined by local assessors to be the total taxable value of land and additions on the property. | Land | Improvement |
|---|---|---|---|---|
| 2025 | $6,511 | $492,500 | $239,300 | $253,200 |
| 2024 | $6,481 | $479,700 | $243,600 | $236,100 |
| 2023 | $6,304 | $443,600 | $232,000 | $211,600 |
| 2022 | $5,696 | $392,300 | $194,500 | $197,800 |
| 2021 | $5,311 | $360,300 | $180,100 | $180,200 |
| 2020 | $4,968 | $341,000 | $180,100 | $160,900 |
| 2019 | $4,872 | $331,400 | $171,500 | $159,900 |
| 2018 | $4,747 | $325,800 | $171,500 | $154,300 |
| 2017 | $4,729 | $314,400 | $160,300 | $154,100 |
| 2016 | $4,788 | $323,100 | $161,600 | $161,500 |
| 2015 | $4,572 | $301,000 | $136,600 | $164,400 |
| 2014 | $4,379 | $292,100 | $127,700 | $164,400 |
Source: Public Records
Map
Nearby Homes
- 406 South St
- 24 Maverick Dr
- 16 Treasure Island Rd
- 450 West St
- 4 Buckskin Dr
- 80 Mill St
- 9 Oak Dr
- 356 Central St
- 47 Old Farm Rd
- 150 Gilbert St
- 166 Chauncy St
- 231 Spring St
- 116 George St
- 12 Spring St
- 11 Landry Ave
- 10 Sleepy Hollow Cir
- 28 Messenger St
- 126 Washington St
- 130 Washington St
- 124 Washington St