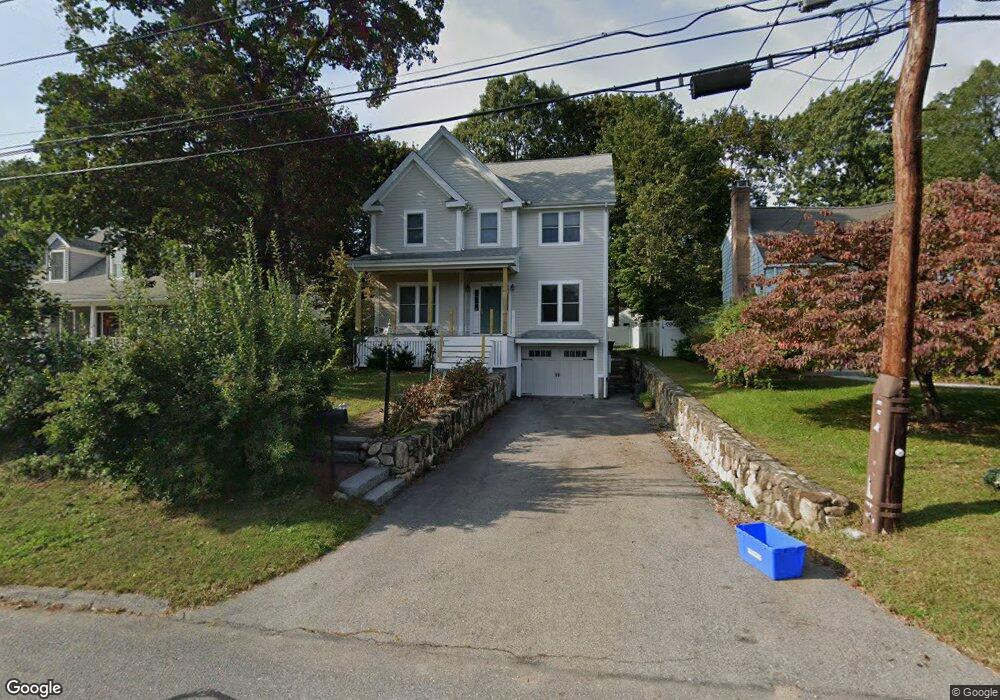
32 Bridge St Lexington, MA 02421
Idylwilde NeighborhoodEstimated Value: $1,762,757 - $2,483,000
4
Beds
3
Baths
2,674
Sq Ft
$790/Sq Ft
Est. Value
About This Home
This home is located at 32 Bridge St, Lexington, MA 02421 and is currently estimated at $2,111,439, approximately $789 per square foot. 32 Bridge St is a home located in Middlesex County with nearby schools including Bridge Elementary School, Jonas Clarke Middle School, and Lexington High School.
Ownership History
Date
Name
Owned For
Owner Type
Purchase Details
Closed on
Jan 27, 2010
Sold by
R & S Rt
Bought by
Zhang Mingjun and Qian Xiaoqing
Current Estimated Value
Home Financials for this Owner
Home Financials are based on the most recent Mortgage that was taken out on this home.
Original Mortgage
$417,000
Outstanding Balance
$274,877
Interest Rate
4.95%
Mortgage Type
Purchase Money Mortgage
Estimated Equity
$1,836,562
Purchase Details
Closed on
Jun 25, 2008
Sold by
Grainger Ft
Bought by
R & S Rt
Home Financials for this Owner
Home Financials are based on the most recent Mortgage that was taken out on this home.
Original Mortgage
$687,500
Interest Rate
6.07%
Mortgage Type
Purchase Money Mortgage
Purchase Details
Closed on
Feb 22, 2008
Sold by
Grainger Leona M
Bought by
Grainger Ft
Create a Home Valuation Report for This Property
The Home Valuation Report is an in-depth analysis detailing your home's value as well as a comparison with similar homes in the area
Home Values in the Area
Average Home Value in this Area
Purchase History
| Date | Buyer | Sale Price | Title Company |
|---|---|---|---|
| Zhang Mingjun | $883,000 | -- | |
| R & S Rt | $350,000 | -- | |
| Grainger Ft | -- | -- |
Source: Public Records
Mortgage History
| Date | Status | Borrower | Loan Amount |
|---|---|---|---|
| Open | Zhang Mingjun | $417,000 | |
| Previous Owner | R & S Rt | $687,500 |
Source: Public Records
Tax History Compared to Growth
Tax History
| Year | Tax Paid | Tax Assessment Tax Assessment Total Assessment is a certain percentage of the fair market value that is determined by local assessors to be the total taxable value of land and additions on the property. | Land | Improvement |
|---|---|---|---|---|
| 2025 | $19,409 | $1,587,000 | $775,000 | $812,000 |
| 2024 | $18,877 | $1,541,000 | $738,000 | $803,000 |
| 2023 | $17,706 | $1,362,000 | $671,000 | $691,000 |
| 2022 | $17,112 | $1,240,000 | $610,000 | $630,000 |
| 2021 | $4,016 | $1,174,000 | $556,000 | $618,000 |
| 2020 | $15,848 | $1,128,000 | $556,000 | $572,000 |
| 2019 | $15,447 | $1,094,000 | $530,000 | $564,000 |
| 2018 | $8,451 | $1,038,000 | $505,000 | $533,000 |
| 2017 | $14,664 | $1,012,000 | $493,000 | $519,000 |
| 2016 | $14,147 | $969,000 | $450,000 | $519,000 |
| 2015 | $13,656 | $919,000 | $409,000 | $510,000 |
| 2014 | $13,649 | $880,000 | $372,000 | $508,000 |
Source: Public Records
Map
Nearby Homes
- 383 Marrett Rd
- 375 Marrett Rd
- 17 Prospect Hill Rd
- 21 Valleyfield St
- 468 Marrett Rd
- 70 Valleyfield St
- 8 Marlboro Rd
- 2 Effie Place
- 20 Loring Rd
- 10 Idylwilde Rd
- 46 Middle St
- 9 Journeys End Ln
- 9 Journeys End Ln Unit 9
- 143 Lincoln St
- 22 Common Ct
- 127 Shade St
- 7 Carmel Cir
- 5 Leroy Rd
- 370 Lincoln St
- 34 Allen St