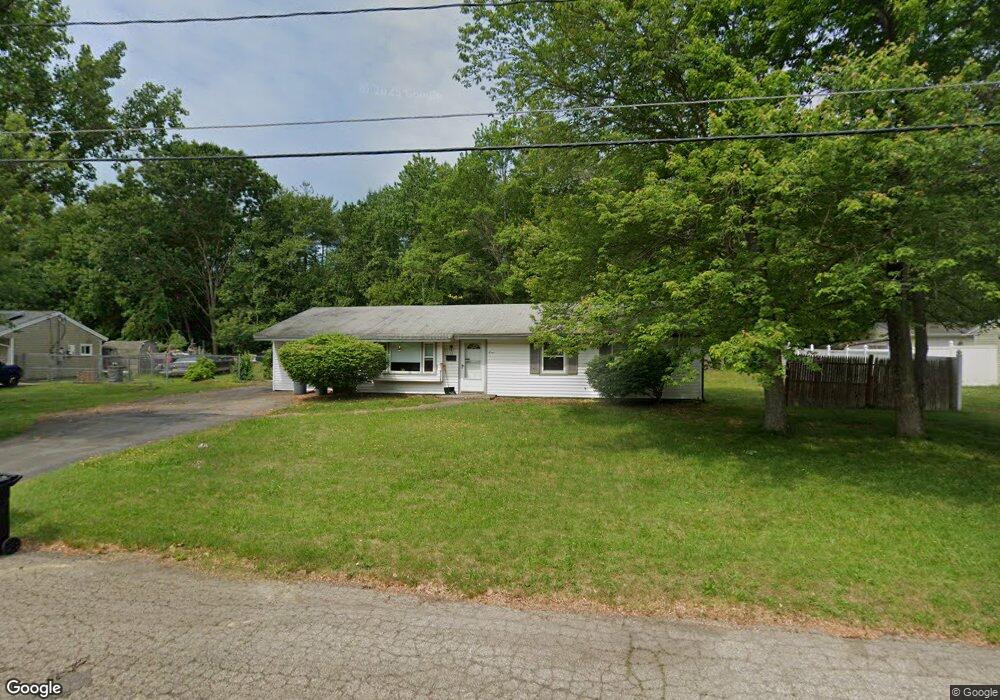
32 Burdett Rd Brockton, MA 02302
Estimated Value: $366,000 - $508,000
3
Beds
1
Bath
1,316
Sq Ft
$343/Sq Ft
Est. Value
About This Home
This home is located at 32 Burdett Rd, Brockton, MA 02302 and is currently estimated at $451,240, approximately $342 per square foot. 32 Burdett Rd is a home located in Plymouth County with nearby schools including Davis K-8 School, John F. Kennedy Elementary School, and South Middle School.
Ownership History
Date
Name
Owned For
Owner Type
Purchase Details
Closed on
Nov 5, 2003
Sold by
Lind Elmer A and Lind Irma P
Bought by
Ameen William M
Current Estimated Value
Home Financials for this Owner
Home Financials are based on the most recent Mortgage that was taken out on this home.
Original Mortgage
$146,160
Interest Rate
6.01%
Mortgage Type
Purchase Money Mortgage
Create a Home Valuation Report for This Property
The Home Valuation Report is an in-depth analysis detailing your home's value as well as a comparison with similar homes in the area
Home Values in the Area
Average Home Value in this Area
Purchase History
| Date | Buyer | Sale Price | Title Company |
|---|---|---|---|
| Ameen William M | $180,000 | -- |
Source: Public Records
Mortgage History
| Date | Status | Borrower | Loan Amount |
|---|---|---|---|
| Open | Ameen William M | $213,000 | |
| Closed | Ameen William M | $192,000 | |
| Closed | Ameen William M | $165,000 | |
| Closed | Ameen William M | $146,160 |
Source: Public Records
Tax History Compared to Growth
Tax History
| Year | Tax Paid | Tax Assessment Tax Assessment Total Assessment is a certain percentage of the fair market value that is determined by local assessors to be the total taxable value of land and additions on the property. | Land | Improvement |
|---|---|---|---|---|
| 2025 | $4,618 | $381,300 | $161,700 | $219,600 |
| 2024 | $4,530 | $376,900 | $161,700 | $215,200 |
| 2023 | $4,357 | $335,700 | $112,100 | $223,600 |
| 2022 | $4,021 | $287,800 | $101,900 | $185,900 |
| 2021 | $4,066 | $280,400 | $95,000 | $185,400 |
| 2020 | $3,977 | $262,500 | $83,200 | $179,300 |
| 2019 | $3,726 | $239,800 | $79,600 | $160,200 |
| 2018 | $3,536 | $220,200 | $79,600 | $140,600 |
| 2017 | $2,933 | $182,200 | $79,600 | $102,600 |
| 2016 | $3,128 | $180,200 | $75,900 | $104,300 |
| 2015 | $2,692 | $148,300 | $75,900 | $72,400 |
| 2014 | $2,921 | $161,100 | $75,900 | $85,200 |
Source: Public Records
Map
Nearby Homes