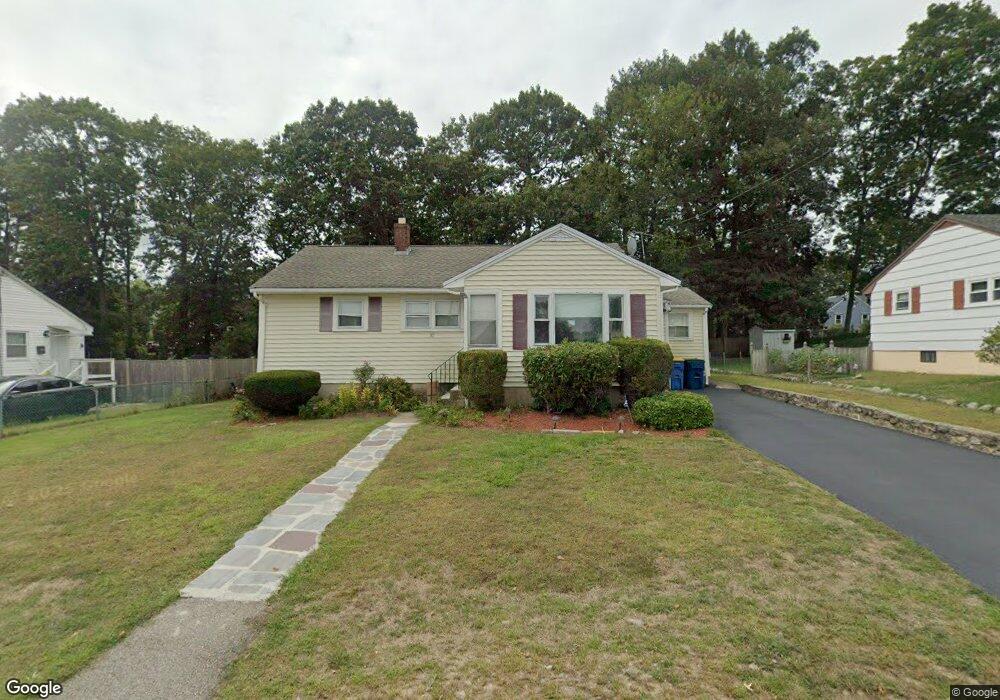
32 Byron St Randolph, MA 02368
North Randolph NeighborhoodEstimated Value: $500,000 - $535,000
3
Beds
1
Bath
1,263
Sq Ft
$415/Sq Ft
Est. Value
About This Home
This home is located at 32 Byron St, Randolph, MA 02368 and is currently estimated at $524,095, approximately $414 per square foot. 32 Byron St is a home located in Norfolk County with nearby schools including Randolph High School, Boston Higashi School, and Lighthouse Baptist Christian Academy.
Ownership History
Date
Name
Owned For
Owner Type
Purchase Details
Closed on
Nov 3, 2003
Sold by
Spector Samuel
Bought by
Ligonde Marie
Current Estimated Value
Home Financials for this Owner
Home Financials are based on the most recent Mortgage that was taken out on this home.
Original Mortgage
$207,200
Outstanding Balance
$90,970
Interest Rate
6.05%
Mortgage Type
Purchase Money Mortgage
Estimated Equity
$433,125
Create a Home Valuation Report for This Property
The Home Valuation Report is an in-depth analysis detailing your home's value as well as a comparison with similar homes in the area
Home Values in the Area
Average Home Value in this Area
Purchase History
| Date | Buyer | Sale Price | Title Company |
|---|---|---|---|
| Ligonde Marie | $259,000 | -- | |
| Ligonde Marie | $259,000 | -- |
Source: Public Records
Mortgage History
| Date | Status | Borrower | Loan Amount |
|---|---|---|---|
| Open | Ligonde Marie | $207,200 | |
| Closed | Ligonde Marie | $207,200 |
Source: Public Records
Tax History
| Year | Tax Paid | Tax Assessment Tax Assessment Total Assessment is a certain percentage of the fair market value that is determined by local assessors to be the total taxable value of land and additions on the property. | Land | Improvement |
|---|---|---|---|---|
| 2025 | $5,402 | $465,300 | $228,500 | $236,800 |
| 2024 | $5,033 | $439,600 | $224,100 | $215,500 |
| 2023 | $4,866 | $402,800 | $203,600 | $199,200 |
| 2022 | $4,741 | $348,600 | $169,700 | $178,900 |
| 2021 | $4,669 | $315,900 | $141,400 | $174,500 |
| 2020 | $4,543 | $304,700 | $141,400 | $163,300 |
| 2019 | $4,358 | $290,900 | $134,700 | $156,200 |
| 2018 | $4,100 | $258,200 | $122,400 | $135,800 |
| 2017 | $3,841 | $237,400 | $116,600 | $120,800 |
| 2016 | $3,643 | $209,500 | $106,000 | $103,500 |
| 2015 | $3,624 | $200,200 | $101,000 | $99,200 |
Source: Public Records
Map
Nearby Homes
- 19 Clark St
- 22 Clark St
- 33 Clark St Unit A
- 20 Jasper Ln
- 12 Jasper Ln Unit 12
- 35 Pearl St Unit 35
- 13 Mcauliffe Rd
- 469 North St
- 11 Mcauliffe Rd
- 71 Pond Ln
- 12 Brewster Rd
- 64 North St
- 5 Dartmouth St
- 37 Himoor Cir
- 14 Lewis Rd
- 1 Royal Crest Dr Unit 3
- 25 Gloversbrook Rd
- 107 Meadow Ln Unit 107
- 11 Lind Terrace
- 41 Maple St
Your Personal Tour Guide
Ask me questions while you tour the home.