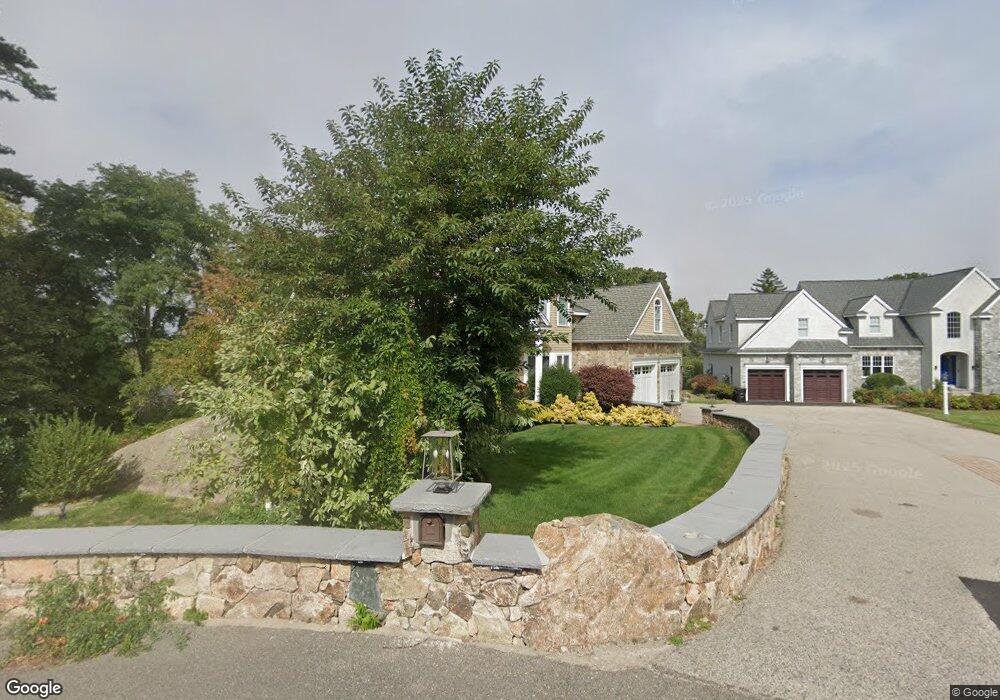
32 Canterbury St Unit 32 Hingham, MA 02043
Estimated Value: $1,690,000 - $2,160,000
5
Beds
5
Baths
5,400
Sq Ft
$359/Sq Ft
Est. Value
About This Home
This home is located at 32 Canterbury St Unit 32, Hingham, MA 02043 and is currently estimated at $1,939,652, approximately $359 per square foot. 32 Canterbury St Unit 32 is a home located in Plymouth County with nearby schools including East Elementary School, St. Paul Elementary School, and Derby Academy.
Ownership History
Date
Name
Owned For
Owner Type
Purchase Details
Closed on
Sep 28, 2017
Sold by
Tracy Melissa J and Reiser Jochen
Bought by
Khadivi Peyman and Khadivi Maryam
Current Estimated Value
Home Financials for this Owner
Home Financials are based on the most recent Mortgage that was taken out on this home.
Original Mortgage
$700,000
Outstanding Balance
$573,547
Interest Rate
3.13%
Mortgage Type
Unknown
Estimated Equity
$1,366,105
Create a Home Valuation Report for This Property
The Home Valuation Report is an in-depth analysis detailing your home's value as well as a comparison with similar homes in the area
Home Values in the Area
Average Home Value in this Area
Purchase History
| Date | Buyer | Sale Price | Title Company |
|---|---|---|---|
| Khadivi Peyman | $950,000 | -- |
Source: Public Records
Mortgage History
| Date | Status | Borrower | Loan Amount |
|---|---|---|---|
| Open | Khadivi Peyman | $700,000 |
Source: Public Records
Tax History Compared to Growth
Tax History
| Year | Tax Paid | Tax Assessment Tax Assessment Total Assessment is a certain percentage of the fair market value that is determined by local assessors to be the total taxable value of land and additions on the property. | Land | Improvement |
|---|---|---|---|---|
| 2025 | $15,112 | $1,413,700 | $475,400 | $938,300 |
| 2024 | $14,483 | $1,334,800 | $475,400 | $859,400 |
| 2023 | $12,602 | $1,260,200 | $475,400 | $784,800 |
| 2022 | $11,231 | $971,500 | $367,000 | $604,500 |
| 2021 | $11,101 | $940,800 | $367,000 | $573,800 |
| 2020 | $10,847 | $940,800 | $367,000 | $573,800 |
| 2019 | $10,702 | $906,200 | $367,000 | $539,200 |
| 2018 | $13,494 | $1,146,500 | $367,000 | $779,500 |
| 2017 | $13,420 | $1,095,500 | $375,300 | $720,200 |
| 2016 | $13,458 | $1,077,500 | $357,300 | $720,200 |
| 2015 | $12,613 | $1,006,600 | $340,100 | $666,500 |
Source: Public Records
Map
Nearby Homes
- LOT 1B Rockland St
- 10 Chestnut Place
- 114 Hull St
- 166 Hull St
- 101 Rockland St
- 321 Rockland St
- 129 Chief Justice Cushing Hwy
- 6 Grace Dr
- 8 Evergreen Ln
- 10 Ocean Ledge Dr
- 45 Ocean Ledge Dr
- 1 Gatehouse Ln Unit 1
- 23 Wyola Rd
- 1 Rockland St
- 54 Salisbury St Waterfront
- 10R Martins Ln
- 22 Berkley Rd Unit B
- 22 Berkley Rd Unit C
- 121 Nantasket Ave Unit 503
- 4 Atherton Rd
- 32 Canterbury St
- 34 Canterbury St
- 36 Canterbury St
- 36 Canterbury St Unit n/a
- 24 Canterbury St
- 30 Canterbury St
- 38 Canterbury St
- 38 Canterbury St Unit 38
- 211 Rockland St
- 209 Rockland St
- 26 Canterbury St
- 28 Canterbury St
- 28 Canterbury St Unit 1
- 28 & 26 Canterbury St
- 22 Canterbury St
- Lot 23 Canterbury Village
- LOT 18 Canterbury Village
- 42 Canterbury St
- LOT 16 Canterbury Village
- Lot 15 Canterbury Village