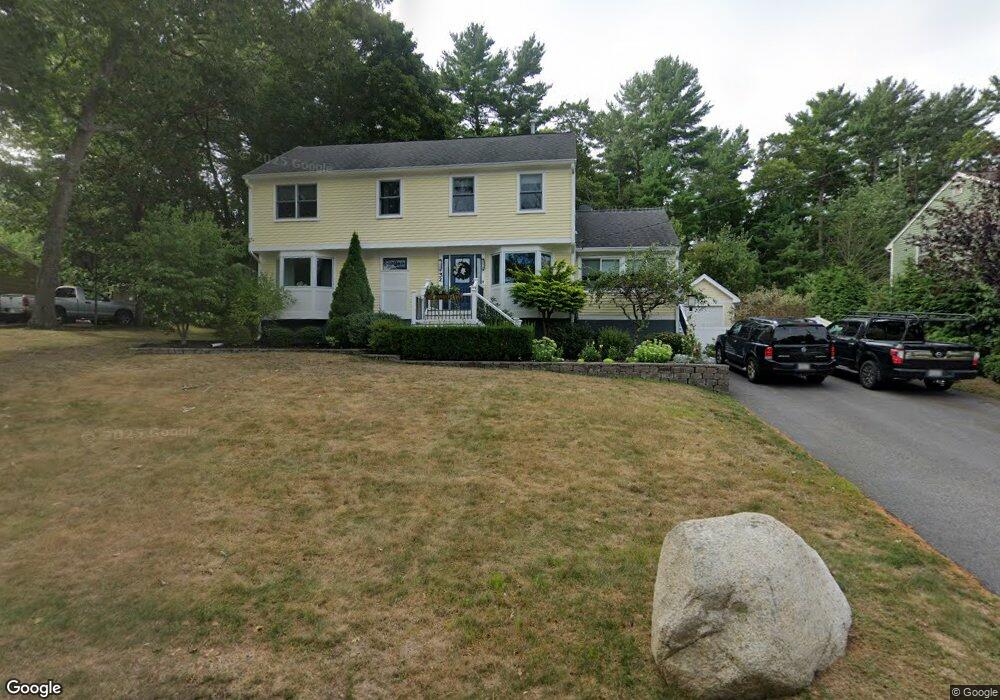
32 Carol Ave Pembroke, MA 02359
Estimated Value: $544,000 - $738,000
--
Bed
2
Baths
1,840
Sq Ft
$347/Sq Ft
Est. Value
About This Home
This home is located at 32 Carol Ave, Pembroke, MA 02359 and is currently estimated at $638,431, approximately $346 per square foot. 32 Carol Ave is a home located in Plymouth County with nearby schools including Pembroke High School.
Ownership History
Date
Name
Owned For
Owner Type
Purchase Details
Closed on
Aug 24, 2009
Sold by
Perry Christopher G and Perry Jannine M
Bought by
Perry Christopher G
Current Estimated Value
Home Financials for this Owner
Home Financials are based on the most recent Mortgage that was taken out on this home.
Original Mortgage
$336,182
Interest Rate
5.19%
Mortgage Type
FHA
Purchase Details
Closed on
Dec 6, 1995
Sold by
Carter David S and Carter Tracy L
Bought by
Perry Christopher G and Perry Jannine M
Purchase Details
Closed on
Sep 28, 1989
Sold by
Partridge Steven R
Bought by
Carter David S
Create a Home Valuation Report for This Property
The Home Valuation Report is an in-depth analysis detailing your home's value as well as a comparison with similar homes in the area
Home Values in the Area
Average Home Value in this Area
Purchase History
| Date | Buyer | Sale Price | Title Company |
|---|---|---|---|
| Perry Christopher G | -- | -- | |
| Perry Christopher G | $124,500 | -- | |
| Carter David S | $127,500 | -- |
Source: Public Records
Mortgage History
| Date | Status | Borrower | Loan Amount |
|---|---|---|---|
| Open | Carter David S | $337,066 | |
| Closed | Carter David S | $336,182 |
Source: Public Records
Tax History Compared to Growth
Tax History
| Year | Tax Paid | Tax Assessment Tax Assessment Total Assessment is a certain percentage of the fair market value that is determined by local assessors to be the total taxable value of land and additions on the property. | Land | Improvement |
|---|---|---|---|---|
| 2025 | $6,474 | $538,600 | $251,800 | $286,800 |
| 2024 | $6,146 | $510,900 | $229,000 | $281,900 |
| 2023 | $5,996 | $471,400 | $229,000 | $242,400 |
| 2022 | $5,701 | $402,900 | $187,400 | $215,500 |
| 2021 | $5,535 | $379,600 | $178,700 | $200,900 |
| 2020 | $5,322 | $367,300 | $170,700 | $196,600 |
| 2019 | $5,170 | $354,100 | $166,400 | $187,700 |
| 2018 | $4,879 | $327,700 | $147,900 | $179,800 |
| 2017 | $4,747 | $314,400 | $139,900 | $174,500 |
| 2016 | $4,689 | $307,300 | $131,900 | $175,400 |
| 2015 | $4,366 | $296,200 | $119,800 | $176,400 |
Source: Public Records
Map
Nearby Homes