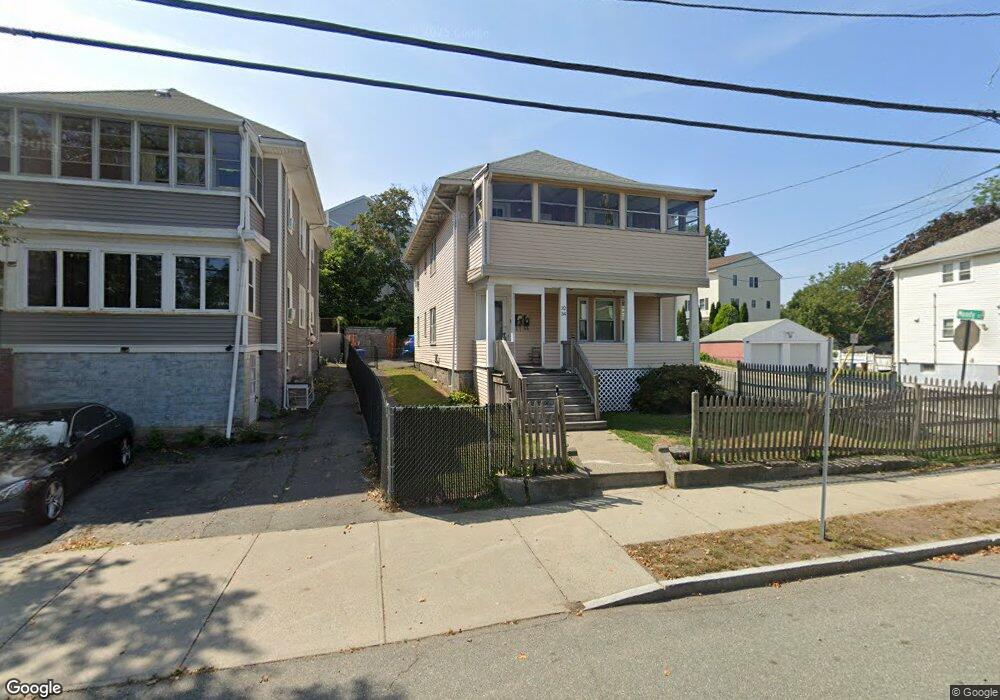
32 Chubbuck St Quincy, MA 02169
Quincy Point NeighborhoodEstimated Value: $743,469 - $807,000
4
Beds
2
Baths
2,100
Sq Ft
$373/Sq Ft
Est. Value
About This Home
This home is located at 32 Chubbuck St, Quincy, MA 02169 and is currently estimated at $782,617, approximately $372 per square foot. 32 Chubbuck St is a home located in Norfolk County with nearby schools including Point Webster Middle School, Clifford H. Marshall Elementary School, and Quincy High School.
Ownership History
Date
Name
Owned For
Owner Type
Purchase Details
Closed on
Oct 20, 2016
Sold by
Glenview Properties Ll
Bought by
Smith Ellsworth S
Current Estimated Value
Purchase Details
Closed on
Aug 27, 2010
Sold by
Higgins Joseph A
Bought by
Higgins Joseph A and Higgins John J
Purchase Details
Closed on
Dec 31, 1997
Sold by
Burke Ex James D
Bought by
Higgins Joseph A
Create a Home Valuation Report for This Property
The Home Valuation Report is an in-depth analysis detailing your home's value as well as a comparison with similar homes in the area
Home Values in the Area
Average Home Value in this Area
Purchase History
| Date | Buyer | Sale Price | Title Company |
|---|---|---|---|
| Smith Ellsworth S | $260,000 | -- | |
| Higgins Joseph A | -- | -- | |
| Higgins Joseph A | $138,000 | -- |
Source: Public Records
Mortgage History
| Date | Status | Borrower | Loan Amount |
|---|---|---|---|
| Previous Owner | Higgins Joseph A | $35,000 | |
| Previous Owner | Higgins Joseph A | $33,000 |
Source: Public Records
Tax History Compared to Growth
Tax History
| Year | Tax Paid | Tax Assessment Tax Assessment Total Assessment is a certain percentage of the fair market value that is determined by local assessors to be the total taxable value of land and additions on the property. | Land | Improvement |
|---|---|---|---|---|
| 2025 | $7,730 | $670,400 | $262,300 | $408,100 |
| 2024 | $7,275 | $645,500 | $249,800 | $395,700 |
| 2023 | $6,794 | $610,400 | $227,100 | $383,300 |
| 2022 | $6,732 | $561,900 | $206,500 | $355,400 |
| 2021 | $6,848 | $564,100 | $206,500 | $357,600 |
| 2020 | $6,820 | $548,700 | $194,800 | $353,900 |
| 2019 | $6,451 | $514,000 | $180,300 | $333,700 |
| 2018 | $5,999 | $449,700 | $164,000 | $285,700 |
| 2017 | $6,041 | $426,300 | $156,100 | $270,200 |
| 2016 | $5,442 | $379,000 | $142,000 | $237,000 |
| 2015 | $5,234 | $358,500 | $133,900 | $224,600 |
| 2014 | $4,632 | $311,700 | $133,900 | $177,800 |
Source: Public Records
Map
Nearby Homes
- 26 Lawrence St
- 41 Broadway
- 934 Southern Artery Unit 109
- 585 Washington St Unit model-1
- 585 Washington St Unit model-2
- 585 Washington St Unit model
- 25 5th Ave
- 200 Falls Blvd Unit B305
- 200 Falls Blvd Unit C308
- 16 Perley Place
- 62 Lawn Ave
- 19 Keyes St
- 161 Sumner St Unit 2
- 161 Sumner St Unit 4
- 15 Bower Rd Unit B5
- 15 Bower Rd Unit A2
- 15 Bower Rd Unit B2
- 25 W Howard St Unit D2
- 51 Sumner St
- 32 Sumner St
- 32 Chubbuck St Unit 32 Chubbuck
- 28 Chubbuck St
- 28 Chubbuck St Unit 2
- 28 Chubbuck St Unit 1
- 42 Chubbuck St Unit 40
- 19 Moody St
- 26 Chubbuck St
- 40 Chubbuck St
- 13 Moody St
- 44 Chubbuck St
- 454 South St
- 20 Moody St
- 18 Moody St
- 20 Moody St Unit 20
- 20 Moody St Unit 3
- 43 Chubbuck St Unit 45
- 16 Moody St
- 45 Chubbuck St Unit 1
- 48 Chubbuck St Unit 1R
- 48 Chubbuck St Unit 1L