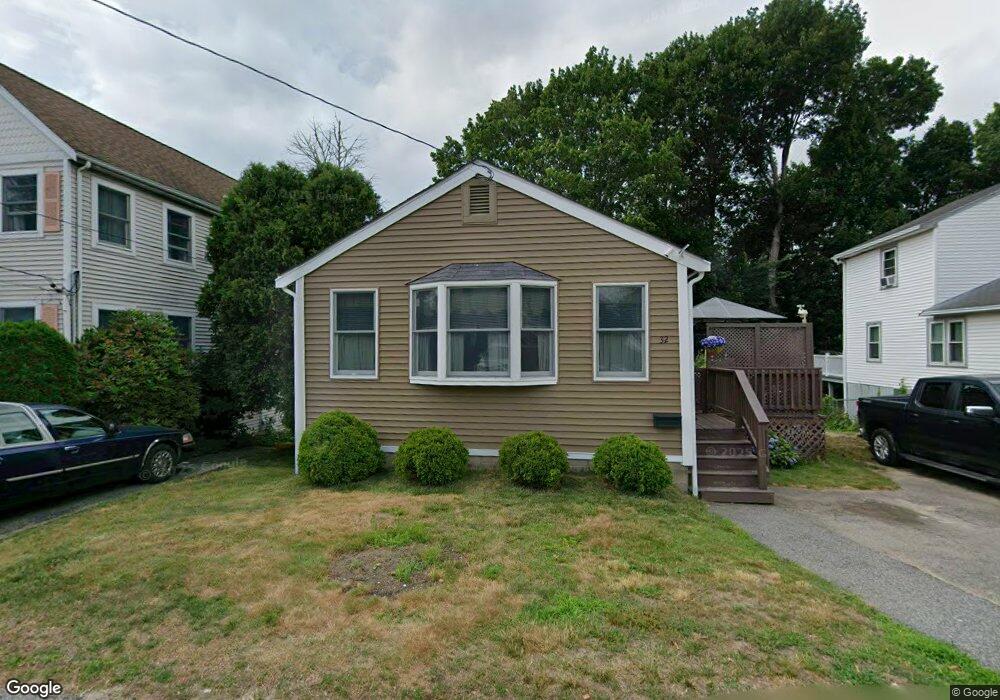
32 Cole St Kingston, MA 02364
Estimated Value: $421,779 - $473,000
2
Beds
1
Bath
648
Sq Ft
$679/Sq Ft
Est. Value
About This Home
This home is located at 32 Cole St, Kingston, MA 02364 and is currently estimated at $439,695, approximately $678 per square foot. 32 Cole St is a home located in Plymouth County with nearby schools including Kingston Elementary School, Silver Lake Regional High School, and Kingston Intermediate School.
Ownership History
Date
Name
Owned For
Owner Type
Purchase Details
Closed on
Jul 14, 2025
Sold by
Peloquin Donald L and Peloquin Linda L
Bought by
Dl Peloquin Irt and Klueber
Current Estimated Value
Purchase Details
Closed on
Nov 28, 1990
Sold by
Sampson Melvin A
Bought by
Peloquin Donald L
Home Financials for this Owner
Home Financials are based on the most recent Mortgage that was taken out on this home.
Original Mortgage
$108,300
Interest Rate
10.16%
Mortgage Type
Purchase Money Mortgage
Create a Home Valuation Report for This Property
The Home Valuation Report is an in-depth analysis detailing your home's value as well as a comparison with similar homes in the area
Home Values in the Area
Average Home Value in this Area
Purchase History
| Date | Buyer | Sale Price | Title Company |
|---|---|---|---|
| Dl Peloquin Irt | -- | -- | |
| Dl Peloquin Irt | -- | -- | |
| Peloquin Donald L | $114,000 | -- | |
| Peloquin Donald L | $114,000 | -- |
Source: Public Records
Mortgage History
| Date | Status | Borrower | Loan Amount |
|---|---|---|---|
| Previous Owner | Peloquin Donald L | $26,000 | |
| Previous Owner | Peloquin Donald L | $16,000 | |
| Previous Owner | Peloquin Donald L | $99,000 | |
| Previous Owner | Peloquin Donald L | $108,300 |
Source: Public Records
Tax History
| Year | Tax Paid | Tax Assessment Tax Assessment Total Assessment is a certain percentage of the fair market value that is determined by local assessors to be the total taxable value of land and additions on the property. | Land | Improvement |
|---|---|---|---|---|
| 2025 | $4,809 | $370,800 | $177,700 | $193,100 |
| 2024 | $4,569 | $359,500 | $177,700 | $181,800 |
| 2023 | $4,406 | $329,800 | $177,700 | $152,100 |
| 2022 | $4,574 | $313,700 | $168,600 | $145,100 |
| 2021 | $9 | $233,400 | $149,200 | $84,200 |
| 2020 | $3,810 | $234,000 | $145,400 | $88,600 |
| 2019 | $3,583 | $217,700 | $139,200 | $78,500 |
| 2018 | $3,471 | $211,000 | $139,200 | $71,800 |
| 2017 | $8 | $194,500 | $130,300 | $64,200 |
| 2016 | $3,034 | $172,300 | $108,500 | $63,800 |
| 2015 | $2,919 | $172,300 | $108,500 | $63,800 |
| 2014 | $2,796 | $167,600 | $103,800 | $63,800 |
Source: Public Records
Map
Nearby Homes
- 24 Chilton Ave
- 12 Curtis Ave
- Lot 17-3 Howlands Ln
- 8 Blair Dr
- 13 Atwood St
- 17 Howlands Ln
- 35 River St
- 94 Main St
- 12 Smiths Ln
- 40 Landing Rd
- 6 Ropewalk Ct Unit 4
- 735 Bay Rd
- 44 Seabury Point Rd
- 393 Court St Unit 3
- 393 Court St Unit 7
- 393 Court St Unit 5
- 20 Seabury Point Rd
- 5-7 Forest Ave
- 111 Loring St
- 100 Parks St Unit 32
- 30 Cole St
- 34 Cole St
- 14 Standish Ave W
- 12 Standish Ave W
- 18 Standish Ave W
- 28 Cole St
- 29 Cole St
- 29 Cole St Unit 29R
- 29 Cole St Unit SI ID1385861P
- 29 Cole St Unit ID1385861P
- 29 Cole St Unit 29 A
- 31 Cole St
- 33 Cole St
- 35 Cole St
- 10 Standish Ave W
- 36 Cole St
- 10 Standish Ave W
- 37 Coles St
- 27 Cole St
- 37 Cole St
Your Personal Tour Guide
Ask me questions while you tour the home.