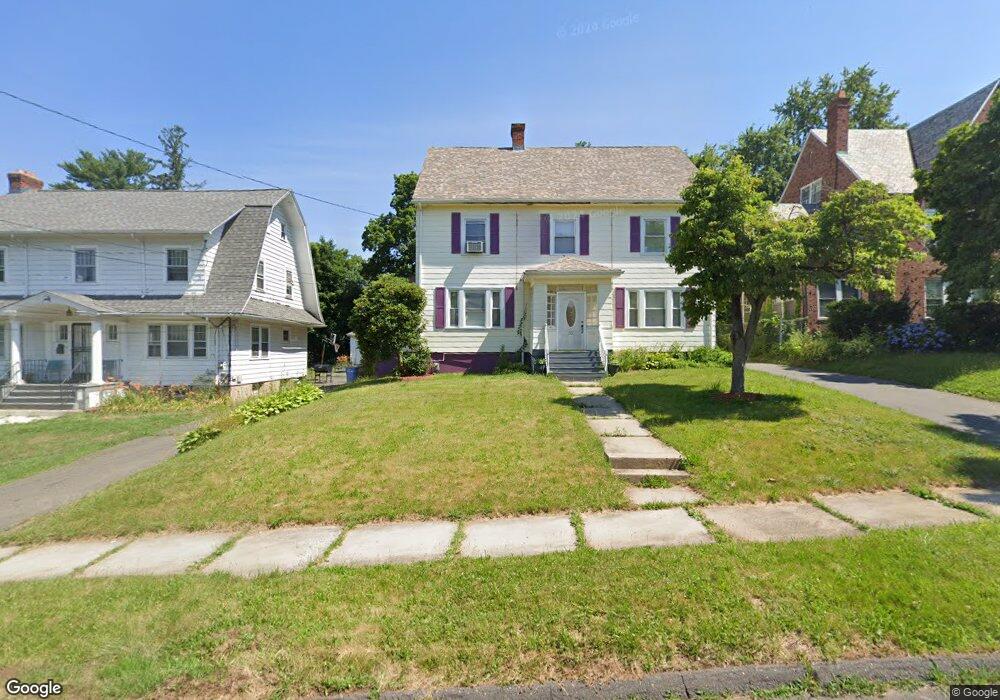
32 Colebrook St Hartford, CT 06112
Blue Hills NeighborhoodEstimated Value: $214,499 - $332,000
4
Beds
2
Baths
2,362
Sq Ft
$116/Sq Ft
Est. Value
About This Home
This home is located at 32 Colebrook St, Hartford, CT 06112 and is currently estimated at $273,125, approximately $115 per square foot. 32 Colebrook St is a home located in Hartford County with nearby schools including Rawson School, Noah Webster Micro Society School, and McKinley School.
Ownership History
Date
Name
Owned For
Owner Type
Purchase Details
Closed on
Dec 14, 2010
Sold by
Mcdonald Deliah
Bought by
Mcdonald Deliah and Mcdonald Omri
Current Estimated Value
Home Financials for this Owner
Home Financials are based on the most recent Mortgage that was taken out on this home.
Original Mortgage
$210,650
Outstanding Balance
$133,994
Interest Rate
4.24%
Mortgage Type
Purchase Money Mortgage
Estimated Equity
$139,131
Purchase Details
Closed on
Jul 29, 2005
Sold by
Mers
Bought by
Brown Deliah
Purchase Details
Closed on
Jan 22, 2001
Sold by
Milner Carl
Bought by
Feliciano Nilda and Johnson Charles
Purchase Details
Closed on
Mar 1, 2000
Sold by
Schulman Marc
Bought by
Milner Carl
Purchase Details
Closed on
Dec 1, 1999
Sold by
Contimortgage Corp
Bought by
Schulman Marc
Create a Home Valuation Report for This Property
The Home Valuation Report is an in-depth analysis detailing your home's value as well as a comparison with similar homes in the area
Home Values in the Area
Average Home Value in this Area
Purchase History
| Date | Buyer | Sale Price | Title Company |
|---|---|---|---|
| Mcdonald Deliah | -- | -- | |
| Brown Deliah | $175,000 | -- | |
| Feliciano Nilda | $123,000 | -- | |
| Milner Carl | $115,000 | -- | |
| Schulman Marc | $50,100 | -- |
Source: Public Records
Mortgage History
| Date | Status | Borrower | Loan Amount |
|---|---|---|---|
| Open | Schulman Marc | $6,169 | |
| Open | Schulman Marc | $210,650 |
Source: Public Records
Tax History Compared to Growth
Tax History
| Year | Tax Paid | Tax Assessment Tax Assessment Total Assessment is a certain percentage of the fair market value that is determined by local assessors to be the total taxable value of land and additions on the property. | Land | Improvement |
|---|---|---|---|---|
| 2025 | $3,943 | $57,183 | $6,946 | $50,237 |
| 2024 | $3,943 | $57,183 | $6,946 | $50,237 |
| 2023 | $3,943 | $57,183 | $6,946 | $50,237 |
| 2022 | $3,943 | $57,183 | $6,946 | $50,237 |
| 2021 | $3,333 | $44,870 | $8,295 | $36,575 |
| 2020 | $3,333 | $44,870 | $8,295 | $36,575 |
| 2019 | $3,333 | $44,870 | $8,295 | $36,575 |
| 2018 | $3,221 | $43,357 | $8,015 | $35,342 |
| 2016 | $3,400 | $45,770 | $7,633 | $38,137 |
| 2015 | $3,239 | $43,596 | $7,271 | $36,325 |
| 2014 | $3,160 | $42,531 | $7,094 | $35,437 |
Source: Public Records
Map
Nearby Homes
- 83 Colebrook St Unit 85
- 211 Holcomb St Unit 213
- 218 Holcomb St Unit 220
- 102 Thomaston St Unit 104
- 355 Cornwall St Unit 357
- 157 Pembroke St Unit 159
- 90 Manchester St
- 10 Baltic St Unit 12
- 11 Pershing St Unit 13
- 181 Westminster St
- 36 Baltic St Unit 38
- 179 Manchester St
- 86 Hartland St
- 275 Westland St
- 111 Westbourne Pkwy Unit 113
- 109 Blue Hills Ave
- 25 Cornwall St
- 97 Boothbay St
- 77 Harold St
- 125 Lebanon St Unit 127
- 28 Colebrook St
- 36 Colebrook St
- 24 Colebrook St
- 42 Colebrook St
- 46 Colebrook St
- 20 Colebrook St
- 145 Holcomb St
- 149 Holcomb St
- 153 Holcomb St
- 157 Holcomb St
- 135 Holcomb St
- 37 Colebrook St
- 23 Colebrook St
- 19 Colebrook St
- 41 Colebrook St
- 370 Blue Hills Ave Unit 372
- 376 Blue Hills Ave Unit 378
- 364 Blue Hills Ave
- 47 Colebrook St
- 378 Blue Hills Ave