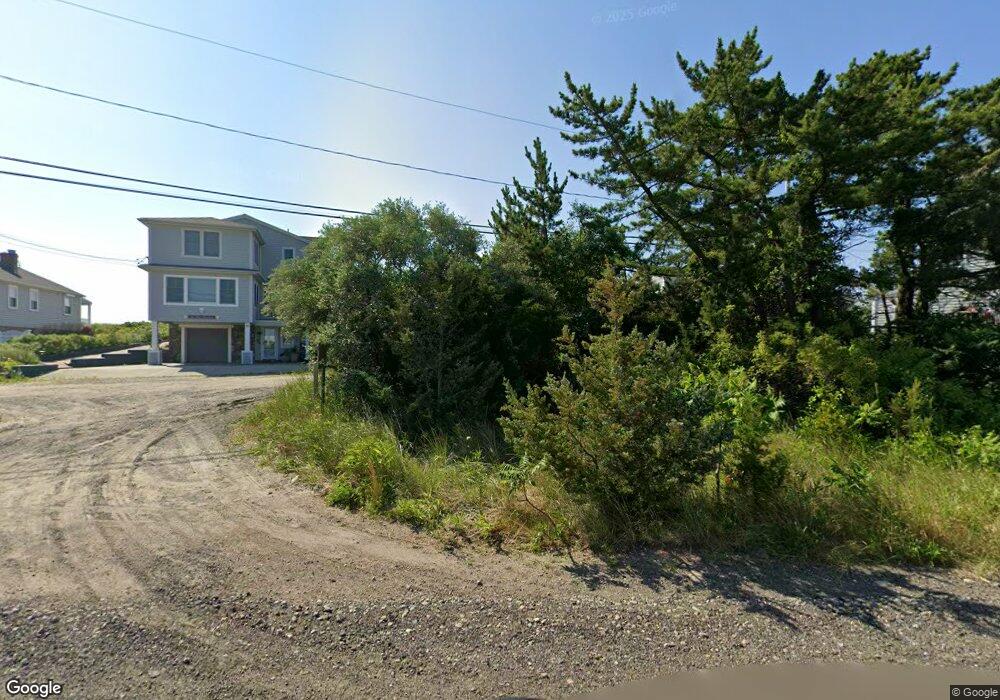
32 Cove St Brant Rock, MA 02020
Ocean Bluff-Brant Rock NeighborhoodEstimated Value: $690,000 - $1,090,000
2
Beds
2
Baths
808
Sq Ft
$1,179/Sq Ft
Est. Value
About This Home
This home is located at 32 Cove St, Brant Rock, MA 02020 and is currently estimated at $952,963, approximately $1,179 per square foot. 32 Cove St is a home with nearby schools including Governor Edward Winslow School, Furnace Brook Middle School, and Marshfield High School.
Ownership History
Date
Name
Owned For
Owner Type
Purchase Details
Closed on
Feb 21, 2024
Sold by
Reilly Doreen E
Bought by
Reilly Doreen E and Reilly Sean D
Current Estimated Value
Purchase Details
Closed on
Feb 17, 2022
Sold by
Knight Winifred C
Bought by
Knight Winifred C and Reilly Doreen E
Purchase Details
Closed on
Jan 6, 1993
Sold by
Miller Franklin L
Bought by
Knight Luke and Knight Winifred C
Create a Home Valuation Report for This Property
The Home Valuation Report is an in-depth analysis detailing your home's value as well as a comparison with similar homes in the area
Home Values in the Area
Average Home Value in this Area
Purchase History
| Date | Buyer | Sale Price | Title Company |
|---|---|---|---|
| Reilly Doreen E | -- | None Available | |
| Reilly Doreen E | -- | None Available | |
| Reilly Doreen E | -- | None Available | |
| Knight Winifred C | -- | None Available | |
| Knight Winifred C | -- | None Available | |
| Knight Winifred C | -- | None Available | |
| Knight Luke | $170,000 | -- |
Source: Public Records
Mortgage History
| Date | Status | Borrower | Loan Amount |
|---|---|---|---|
| Previous Owner | Knight Luke | $60,000 |
Source: Public Records
Tax History
| Year | Tax Paid | Tax Assessment Tax Assessment Total Assessment is a certain percentage of the fair market value that is determined by local assessors to be the total taxable value of land and additions on the property. | Land | Improvement |
|---|---|---|---|---|
| 2025 | $10,638 | $1,074,500 | $835,500 | $239,000 |
| 2024 | $9,838 | $946,900 | $736,000 | $210,900 |
| 2023 | $7,900 | $813,000 | $636,500 | $176,500 |
| 2022 | $7,900 | $610,000 | $467,500 | $142,500 |
| 2021 | $7,967 | $604,000 | $467,500 | $136,500 |
| 2020 | $7,574 | $568,200 | $437,600 | $130,600 |
| 2019 | $7,522 | $562,200 | $437,600 | $124,600 |
| 2018 | $7,517 | $562,200 | $437,600 | $124,600 |
| 2017 | $7,606 | $554,400 | $437,600 | $116,800 |
| 2016 | $7,628 | $549,600 | $437,600 | $112,000 |
| 2015 | $8,362 | $629,200 | $517,200 | $112,000 |
| 2014 | $8,268 | $622,100 | $517,200 | $104,900 |
Source: Public Records
Map
Nearby Homes
- 98 Cherry St
- 116 Island St
- 106 Careswell St
- 256 Ocean St
- 17 Dyke Rd
- 71 Gurnet Rd
- 78 Tower Ave
- 122 June St
- 116 Outlook Rd
- 32 Gratto Rd
- 86 Barouche Dr
- 236 Powder Point Ave
- 85 Constitution Rd
- 39 Bay Pond Rd
- 387 Lot 2A Old Cove Rd
- 387 Lot 3A Old Cove Rd
- 387 Lot 4A Old Cove Rd
- 568 Webster St
- 30 Chandler Dr
- 42 Carr Rd
Your Personal Tour Guide
Ask me questions while you tour the home.