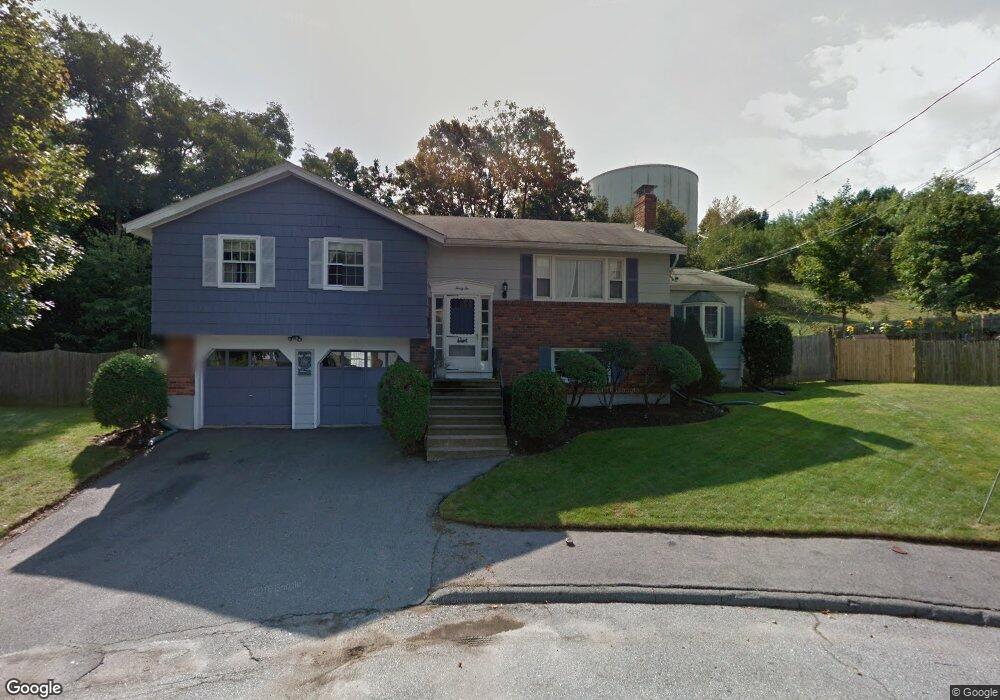
32 Crescent Dr Salem, MA 01970
Witchcraft Heights NeighborhoodEstimated Value: $722,877 - $789,000
4
Beds
3
Baths
2,070
Sq Ft
$369/Sq Ft
Est. Value
About This Home
This home is located at 32 Crescent Dr, Salem, MA 01970 and is currently estimated at $763,469, approximately $368 per square foot. 32 Crescent Dr is a home located in Essex County with nearby schools including Witchcraft Heights Elementary School, Horace Mann Laboratory, and Bates Elementary School.
Ownership History
Date
Name
Owned For
Owner Type
Purchase Details
Closed on
Nov 18, 2002
Sold by
Manley-Hirtle Carole
Bought by
Kwapis Beth and Kwapis David J
Current Estimated Value
Home Financials for this Owner
Home Financials are based on the most recent Mortgage that was taken out on this home.
Original Mortgage
$205,000
Outstanding Balance
$85,127
Interest Rate
6.03%
Mortgage Type
Purchase Money Mortgage
Estimated Equity
$678,342
Create a Home Valuation Report for This Property
The Home Valuation Report is an in-depth analysis detailing your home's value as well as a comparison with similar homes in the area
Home Values in the Area
Average Home Value in this Area
Purchase History
| Date | Buyer | Sale Price | Title Company |
|---|---|---|---|
| Kwapis Beth | $376,000 | -- |
Source: Public Records
Mortgage History
| Date | Status | Borrower | Loan Amount |
|---|---|---|---|
| Open | Kwapis Beth | $205,000 |
Source: Public Records
Tax History Compared to Growth
Tax History
| Year | Tax Paid | Tax Assessment Tax Assessment Total Assessment is a certain percentage of the fair market value that is determined by local assessors to be the total taxable value of land and additions on the property. | Land | Improvement |
|---|---|---|---|---|
| 2025 | $7,221 | $636,800 | $256,100 | $380,700 |
| 2024 | $7,207 | $620,200 | $241,700 | $378,500 |
| 2023 | $6,994 | $559,100 | $220,000 | $339,100 |
| 2022 | $6,508 | $491,200 | $202,000 | $289,200 |
| 2021 | $6,326 | $458,400 | $187,600 | $270,800 |
| 2020 | $6,429 | $444,900 | $184,000 | $260,900 |
| 2019 | $6,374 | $422,100 | $173,100 | $249,000 |
| 2018 | $6,109 | $397,200 | $161,600 | $235,600 |
| 2017 | $5,870 | $370,100 | $151,500 | $218,600 |
| 2016 | $5,799 | $370,100 | $151,500 | $218,600 |
| 2015 | $5,504 | $335,400 | $133,500 | $201,900 |
Source: Public Records
Map
Nearby Homes
- 36 Summit St
- 15 Wall St
- 23 Proctor St
- 57 Ord St
- 2 Hillside Ave
- 55 Butler St
- 38 Valley St
- 128 Boston St Unit 4
- 2 Osborne St
- 119 Highland Ave
- 35 Flint St Unit 209
- 35 Flint St Unit 106
- 145 Federal St Unit 3
- 9 Sutton St
- 38 Chestnut St
- 176 Marlborough Rd
- 13 State St
- 1 Ugo Rd
- 36 Irving St Unit B
- 22 Prescott St Unit 2