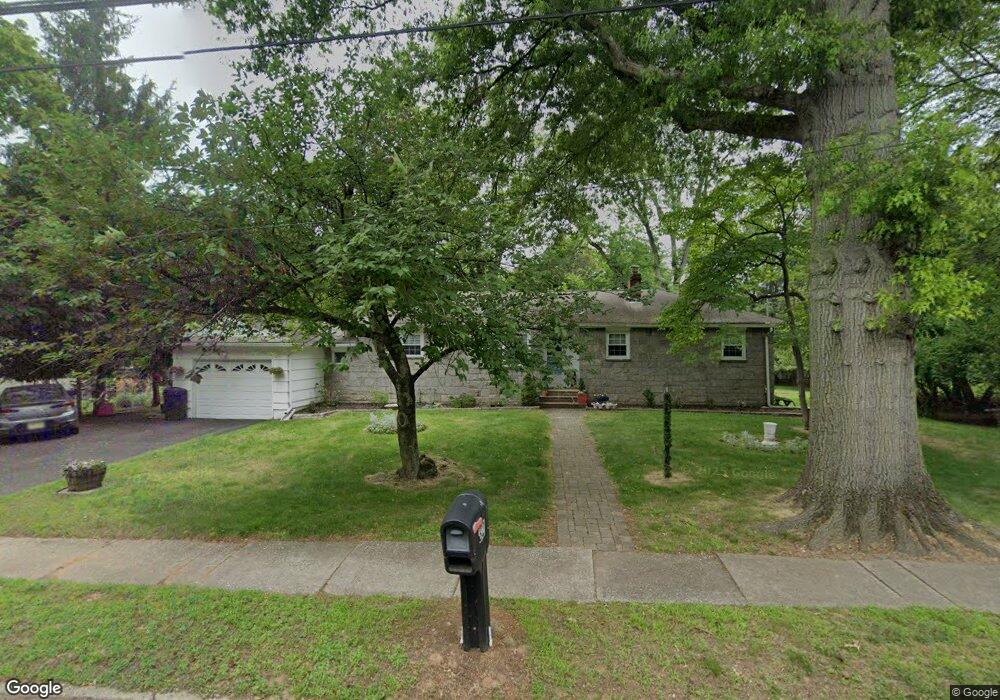
32 Cripplebush Rd Old Tappan, NJ 07675
Estimated Value: $709,274 - $1,006,000
--
Bed
--
Bath
1,192
Sq Ft
$725/Sq Ft
Est. Value
About This Home
This home is located at 32 Cripplebush Rd, Old Tappan, NJ 07675 and is currently estimated at $864,069, approximately $724 per square foot. 32 Cripplebush Rd is a home located in Bergen County with nearby schools including T. Baldwin Demarest Elementary School, Charles DeWolf Middle School, and Northern Valley Regional High School at Old Tappan.
Ownership History
Date
Name
Owned For
Owner Type
Purchase Details
Closed on
Jul 12, 1994
Sold by
Infuso Susan
Bought by
Brazaitis Elizabeth
Current Estimated Value
Home Financials for this Owner
Home Financials are based on the most recent Mortgage that was taken out on this home.
Original Mortgage
$110,000
Interest Rate
8.19%
Create a Home Valuation Report for This Property
The Home Valuation Report is an in-depth analysis detailing your home's value as well as a comparison with similar homes in the area
Home Values in the Area
Average Home Value in this Area
Purchase History
| Date | Buyer | Sale Price | Title Company |
|---|---|---|---|
| Brazaitis Elizabeth | $200,000 | -- |
Source: Public Records
Mortgage History
| Date | Status | Borrower | Loan Amount |
|---|---|---|---|
| Closed | Brazaitis Elizabeth | $110,000 |
Source: Public Records
Tax History Compared to Growth
Tax History
| Year | Tax Paid | Tax Assessment Tax Assessment Total Assessment is a certain percentage of the fair market value that is determined by local assessors to be the total taxable value of land and additions on the property. | Land | Improvement |
|---|---|---|---|---|
| 2025 | $9,339 | $424,100 | $307,600 | $116,500 |
| 2024 | $9,135 | $424,100 | $307,600 | $116,500 |
| 2023 | $9,025 | $424,100 | $307,600 | $116,500 |
| 2022 | $9,025 | $424,100 | $307,600 | $116,500 |
| 2021 | $8,385 | $424,100 | $307,600 | $116,500 |
| 2020 | $8,872 | $424,100 | $307,600 | $116,500 |
| 2019 | $8,749 | $424,100 | $307,600 | $116,500 |
| 2018 | $8,571 | $424,100 | $307,600 | $116,500 |
| 2017 | $8,503 | $424,100 | $307,600 | $116,500 |
| 2016 | $8,283 | $424,100 | $307,600 | $116,500 |
| 2015 | $8,151 | $406,300 | $307,600 | $98,700 |
| 2014 | $7,602 | $406,300 | $307,600 | $98,700 |
Source: Public Records
Map
Nearby Homes