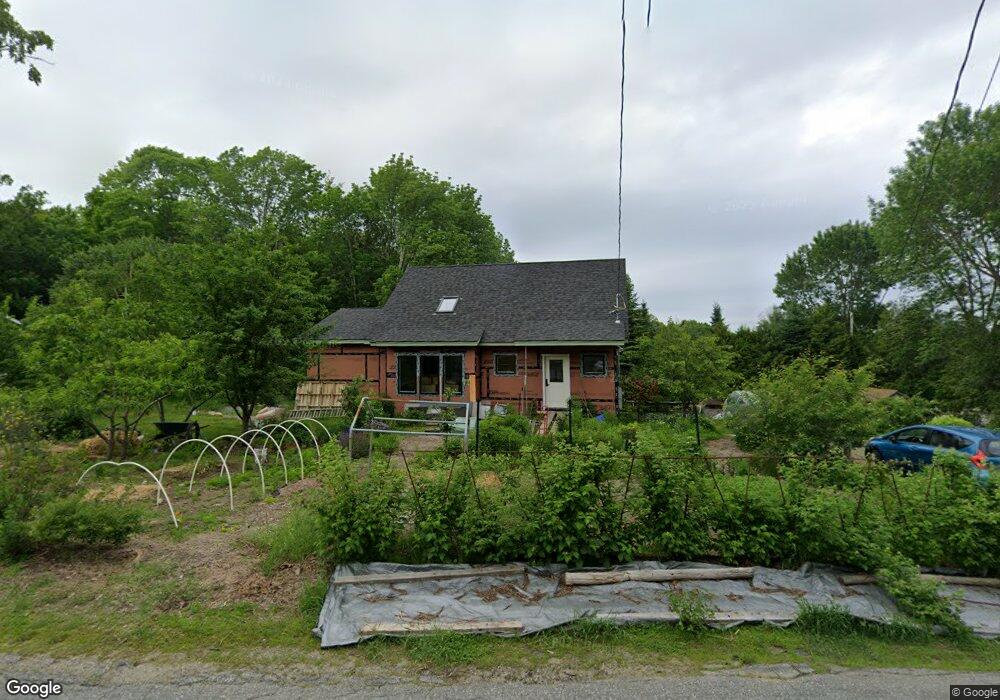
32 Curtis Ave Camden, ME 04843
Estimated Value: $650,000 - $913,000
2
Beds
1
Bath
2,068
Sq Ft
$365/Sq Ft
Est. Value
About This Home
This home is located at 32 Curtis Ave, Camden, ME 04843 and is currently estimated at $754,993, approximately $365 per square foot. 32 Curtis Ave is a home located in Knox County with nearby schools including Camden-Rockport Elementary School, Camden-Rockport Middle School, and Camden Hills Regional High School.
Ownership History
Date
Name
Owned For
Owner Type
Purchase Details
Closed on
Aug 11, 2014
Sold by
Cubberly Dorothea R
Bought by
Killoran Nancy and Ellis Hildy G
Current Estimated Value
Home Financials for this Owner
Home Financials are based on the most recent Mortgage that was taken out on this home.
Original Mortgage
$105,000
Outstanding Balance
$32,487
Interest Rate
3.23%
Mortgage Type
New Conventional
Estimated Equity
$722,506
Create a Home Valuation Report for This Property
The Home Valuation Report is an in-depth analysis detailing your home's value as well as a comparison with similar homes in the area
Home Values in the Area
Average Home Value in this Area
Purchase History
| Date | Buyer | Sale Price | Title Company |
|---|---|---|---|
| Killoran Nancy | -- | -- |
Source: Public Records
Mortgage History
| Date | Status | Borrower | Loan Amount |
|---|---|---|---|
| Open | Killoran Nancy | $105,000 |
Source: Public Records
Tax History Compared to Growth
Tax History
| Year | Tax Paid | Tax Assessment Tax Assessment Total Assessment is a certain percentage of the fair market value that is determined by local assessors to be the total taxable value of land and additions on the property. | Land | Improvement |
|---|---|---|---|---|
| 2024 | $6,425 | $611,900 | $283,300 | $328,600 |
| 2023 | $4,307 | $312,100 | $100,100 | $212,000 |
| 2022 | $4,120 | $312,100 | $100,100 | $212,000 |
| 2021 | $3,486 | $227,100 | $91,300 | $135,800 |
| 2020 | $3,331 | $221,600 | $91,300 | $130,300 |
| 2019 | $3,304 | $221,600 | $91,300 | $130,300 |
| 2018 | $3,122 | $209,800 | $86,900 | $122,900 |
| 2017 | $3,017 | $209,800 | $86,900 | $122,900 |
| 2016 | $3,048 | $195,500 | $83,200 | $112,300 |
| 2015 | $2,958 | $195,500 | $83,200 | $112,300 |
| 2014 | $2,821 | $195,500 | $83,200 | $112,300 |
| 2013 | $2,745 | $195,500 | $83,200 | $112,300 |
Source: Public Records
Map
Nearby Homes