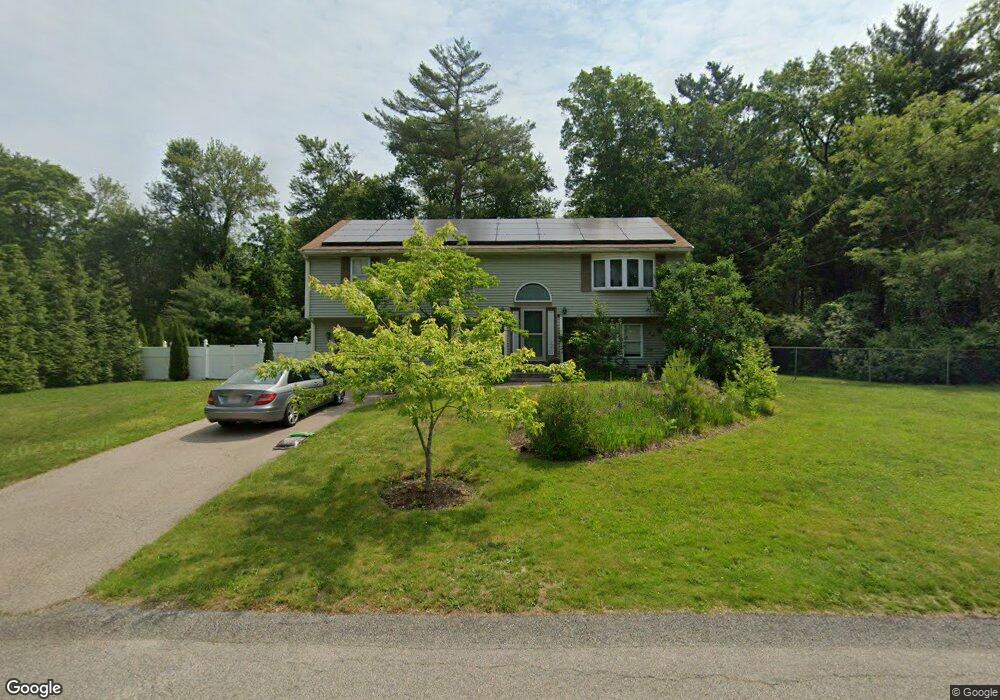
32 Cushing Rd Brockton, MA 02302
Estimated Value: $508,000 - $625,000
3
Beds
1
Bath
1,927
Sq Ft
$288/Sq Ft
Est. Value
About This Home
This home is located at 32 Cushing Rd, Brockton, MA 02302 and is currently estimated at $555,829, approximately $288 per square foot. 32 Cushing Rd is a home located in Plymouth County with nearby schools including Gilmore Elementary School, Davis K-8 School, and John F. Kennedy Elementary School.
Ownership History
Date
Name
Owned For
Owner Type
Purchase Details
Closed on
Jun 20, 2025
Sold by
Abdelnour Edward and Abdelnour Debra J
Bought by
Abdelnour Edward D
Current Estimated Value
Home Financials for this Owner
Home Financials are based on the most recent Mortgage that was taken out on this home.
Original Mortgage
$433,200
Outstanding Balance
$431,713
Interest Rate
6.81%
Mortgage Type
VA
Estimated Equity
$124,116
Purchase Details
Closed on
Apr 11, 2002
Sold by
Colonial Constr Co T
Bought by
Abdelnour Edward and Abdelnour Debra J
Create a Home Valuation Report for This Property
The Home Valuation Report is an in-depth analysis detailing your home's value as well as a comparison with similar homes in the area
Purchase History
| Date | Buyer | Sale Price | Title Company |
|---|---|---|---|
| Abdelnour Edward D | -- | None Available | |
| Abdelnour Edward D | -- | None Available | |
| Abdelnour Edward | $184,275 | -- | |
| Abdelnour Edward | $184,275 | -- |
Source: Public Records
Mortgage History
| Date | Status | Borrower | Loan Amount |
|---|---|---|---|
| Open | Abdelnour Edward D | $433,200 | |
| Closed | Abdelnour Edward D | $433,200 | |
| Previous Owner | Abdelnour Edward | $320,000 | |
| Previous Owner | Abdelnour Edward | $280,000 |
Source: Public Records
Tax History
| Year | Tax Paid | Tax Assessment Tax Assessment Total Assessment is a certain percentage of the fair market value that is determined by local assessors to be the total taxable value of land and additions on the property. | Land | Improvement |
|---|---|---|---|---|
| 2025 | $6,136 | $506,700 | $184,500 | $322,200 |
| 2024 | $6,079 | $505,700 | $184,500 | $321,200 |
| 2023 | $5,994 | $461,800 | $138,600 | $323,200 |
| 2022 | $5,538 | $396,400 | $126,000 | $270,400 |
| 2021 | $5,462 | $376,700 | $108,900 | $267,800 |
| 2020 | $5,340 | $352,500 | $95,000 | $257,500 |
| 2019 | $5,186 | $333,700 | $90,500 | $243,200 |
| 2018 | $4,723 | $294,100 | $90,500 | $203,600 |
| 2017 | $4,407 | $273,700 | $90,500 | $183,200 |
| 2016 | $4,672 | $269,100 | $87,000 | $182,100 |
| 2015 | $4,639 | $255,600 | $87,000 | $168,600 |
| 2014 | $4,157 | $229,300 | $87,000 | $142,300 |
Source: Public Records
Map
Nearby Homes
- 578 Plain St
- 1 Thomas Cir
- 23 Dondi Rd
- 118 Deanna Rd
- 15 Wachusetts Rd
- 463 Pleasant St
- 32 Foothill Rd
- 12 Paulin Ave
- 31 Friendship Dr
- 16 Liberty St
- 10 Colleen Way
- 18 American Ave
- 16 Jason Way
- 9 Longworth Ave Unit 135
- 15 Longworth Ave Unit 226
- 25 Longworth Ave Unit 4
- 35 Longworth Ave Unit 25
- 323 Matfield St
- 111 Riverview St
- 41 Riverview St
Your Personal Tour Guide
Ask me questions while you tour the home.