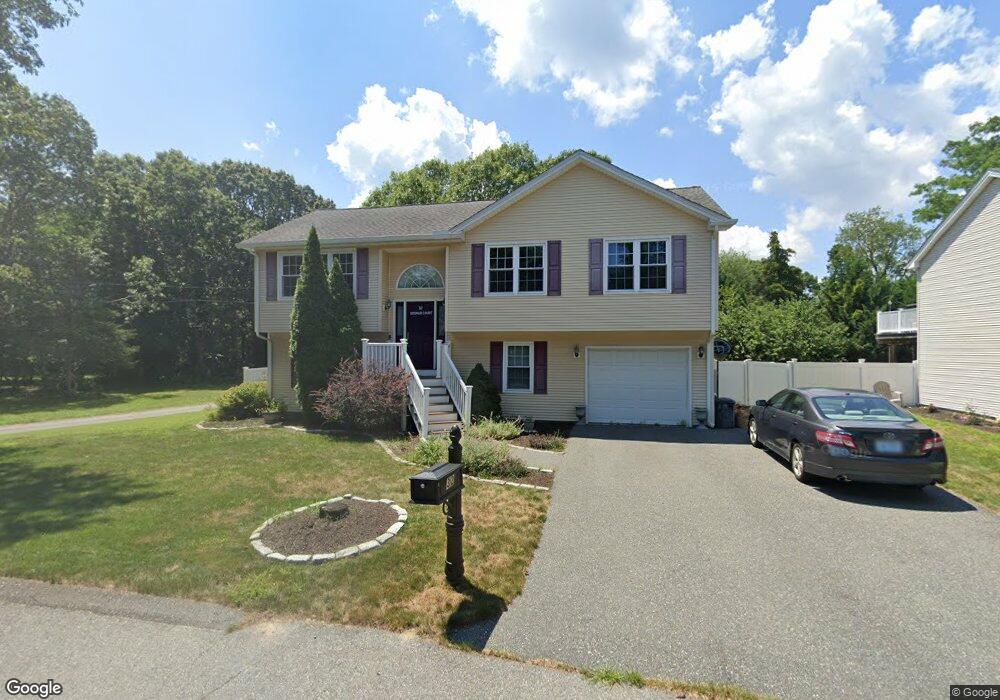
32 Desmar Ct Warwick, RI 02889
Oakland Beach NeighborhoodEstimated Value: $410,000 - $460,000
3
Beds
1
Bath
1,708
Sq Ft
$256/Sq Ft
Est. Value
About This Home
This home is located at 32 Desmar Ct, Warwick, RI 02889 and is currently estimated at $437,064, approximately $255 per square foot. 32 Desmar Ct is a home located in Kent County with nearby schools including Saint Kevin School and Bishop Hendricken High School.
Ownership History
Date
Name
Owned For
Owner Type
Purchase Details
Closed on
Oct 19, 2009
Sold by
Dorsey Duane M and Dorsey Vera L
Bought by
Dorsey Duane M and Dorsey Vera L
Current Estimated Value
Purchase Details
Closed on
Apr 30, 2008
Sold by
Lombardo Anthony F and Lombardo Shawna R
Bought by
Dorsey Duane M and Melo Vera L
Home Financials for this Owner
Home Financials are based on the most recent Mortgage that was taken out on this home.
Original Mortgage
$196,000
Interest Rate
5.99%
Mortgage Type
Purchase Money Mortgage
Purchase Details
Closed on
Apr 11, 2002
Sold by
Perry Gary J and Perry Desiree C
Bought by
Lombardo Anthony F and Feinman Michael D
Home Financials for this Owner
Home Financials are based on the most recent Mortgage that was taken out on this home.
Original Mortgage
$132,240
Interest Rate
6.84%
Mortgage Type
Purchase Money Mortgage
Create a Home Valuation Report for This Property
The Home Valuation Report is an in-depth analysis detailing your home's value as well as a comparison with similar homes in the area
Home Values in the Area
Average Home Value in this Area
Purchase History
| Date | Buyer | Sale Price | Title Company |
|---|---|---|---|
| Dorsey Duane M | -- | -- | |
| Dorsey Duane M | $249,000 | -- | |
| Lombardo Anthony F | $163,000 | -- |
Source: Public Records
Mortgage History
| Date | Status | Borrower | Loan Amount |
|---|---|---|---|
| Open | Lombardo Anthony F | $164,000 | |
| Previous Owner | Lombardo Anthony F | $196,000 | |
| Previous Owner | Lombardo Anthony F | $132,240 |
Source: Public Records
Tax History Compared to Growth
Tax History
| Year | Tax Paid | Tax Assessment Tax Assessment Total Assessment is a certain percentage of the fair market value that is determined by local assessors to be the total taxable value of land and additions on the property. | Land | Improvement |
|---|---|---|---|---|
| 2025 | $5,006 | $394,200 | $102,000 | $292,200 |
| 2024 | $4,872 | $336,700 | $84,200 | $252,500 |
| 2023 | $4,778 | $336,700 | $84,200 | $252,500 |
| 2022 | $4,480 | $239,200 | $47,700 | $191,500 |
| 2021 | $4,480 | $239,200 | $47,700 | $191,500 |
| 2020 | $4,480 | $239,200 | $47,700 | $191,500 |
| 2019 | $4,480 | $239,200 | $47,700 | $191,500 |
| 2018 | $3,902 | $187,600 | $47,700 | $139,900 |
| 2017 | $3,797 | $187,600 | $47,700 | $139,900 |
| 2016 | $3,797 | $187,600 | $47,700 | $139,900 |
| 2015 | $4,181 | $201,500 | $70,800 | $130,700 |
| 2014 | $4,042 | $201,500 | $70,800 | $130,700 |
| 2013 | $3,988 | $201,500 | $70,800 | $130,700 |
Source: Public Records
Map
Nearby Homes