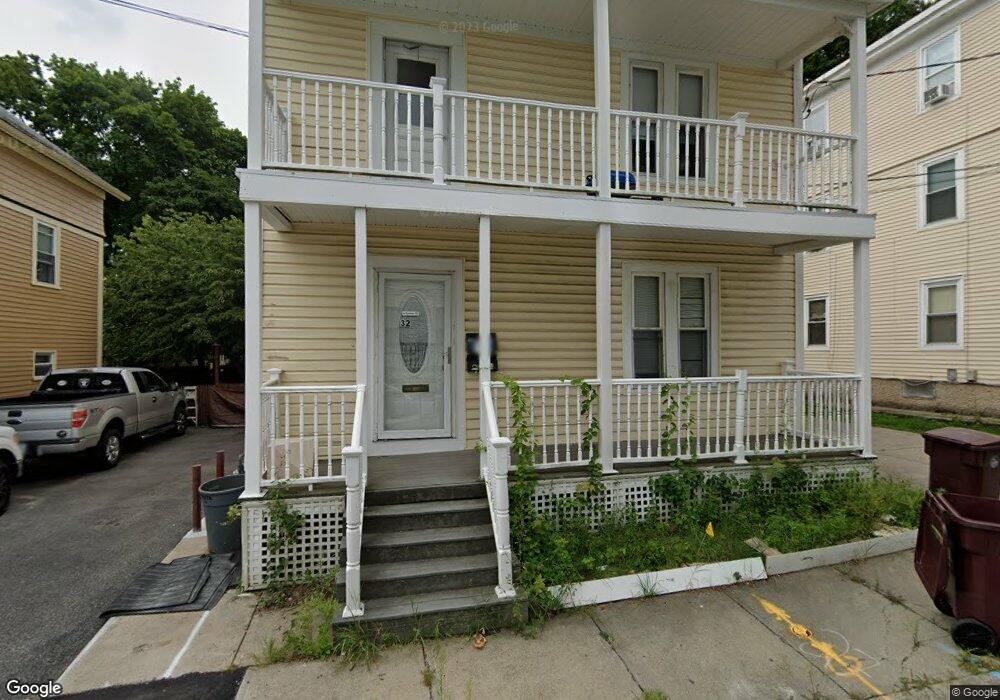
32 Dexter St Woonsocket, RI 02895
North End NeighborhoodEstimated Value: $393,318 - $444,000
4
Beds
2
Baths
1,750
Sq Ft
$242/Sq Ft
Est. Value
About This Home
This home is located at 32 Dexter St, Woonsocket, RI 02895 and is currently estimated at $424,330, approximately $242 per square foot. 32 Dexter St is a home located in Providence County with nearby schools including Woonsocket High School, Rise Prep Mayoral Academy Middle School, and Rise Prep Mayoral Academy.
Ownership History
Date
Name
Owned For
Owner Type
Purchase Details
Closed on
Jul 7, 2021
Sold by
Ho Nhan T and Dao Hatram N
Bought by
Pham Allen A and Tang Angie T
Current Estimated Value
Home Financials for this Owner
Home Financials are based on the most recent Mortgage that was taken out on this home.
Original Mortgage
$140,000
Outstanding Balance
$125,643
Interest Rate
2.9%
Mortgage Type
Purchase Money Mortgage
Estimated Equity
$298,687
Purchase Details
Closed on
Oct 8, 2002
Sold by
Rogan Carole and Eithier Thomas
Bought by
Ho Nhan Thanh
Purchase Details
Closed on
Mar 2, 2001
Sold by
Santiago Carlos L
Bought by
Rogan Carole and Eithier Thomas
Purchase Details
Closed on
May 1, 1997
Sold by
Day Robert E
Bought by
Santiago Carlos L
Purchase Details
Closed on
Oct 15, 1990
Sold by
Parms Inc
Bought by
Lavoie Jane C
Create a Home Valuation Report for This Property
The Home Valuation Report is an in-depth analysis detailing your home's value as well as a comparison with similar homes in the area
Home Values in the Area
Average Home Value in this Area
Purchase History
| Date | Buyer | Sale Price | Title Company |
|---|---|---|---|
| Pham Allen A | $172,000 | None Available | |
| Pham Allen A | $172,000 | None Available | |
| Pham Allen A | $172,000 | None Available | |
| Ho Nhan Thanh | $145,000 | -- | |
| Rogan Carole | $76,000 | -- | |
| Rogan Carole | $76,000 | -- | |
| Santiago Carlos L | $43,000 | -- | |
| Santiago Carlos L | $43,000 | -- | |
| Lavoie Jane C | $99,000 | -- |
Source: Public Records
Mortgage History
| Date | Status | Borrower | Loan Amount |
|---|---|---|---|
| Open | Pham Allen A | $140,000 | |
| Closed | Pham Allen A | $140,000 | |
| Previous Owner | Lavoie Jane C | $216,546 | |
| Previous Owner | Lavoie Jane C | $55,258 |
Source: Public Records
Tax History
| Year | Tax Paid | Tax Assessment Tax Assessment Total Assessment is a certain percentage of the fair market value that is determined by local assessors to be the total taxable value of land and additions on the property. | Land | Improvement |
|---|---|---|---|---|
| 2025 | $4,335 | $386,000 | $82,300 | $303,700 |
| 2024 | $3,953 | $271,900 | $83,800 | $188,100 |
| 2023 | $3,801 | $271,900 | $83,800 | $188,100 |
| 2022 | $3,801 | $271,900 | $83,800 | $188,100 |
| 2021 | $3,510 | $147,800 | $53,500 | $94,300 |
| 2020 | $3,547 | $147,800 | $53,500 | $94,300 |
| 2018 | $3,559 | $147,800 | $53,500 | $94,300 |
| 2017 | $3,498 | $116,200 | $37,400 | $78,800 |
| 2016 | $3,700 | $116,200 | $37,400 | $78,800 |
| 2015 | $4,251 | $116,200 | $37,400 | $78,800 |
| 2014 | $4,101 | $114,100 | $41,100 | $73,000 |
Source: Public Records
Map
Nearby Homes
- 481 N Main St
- 164 W School St
- 130 E School St
- 550 Winter St
- 187 Boyden St
- 571 Winter St
- 107 Blackstone St
- 154 156 Winter St
- 0 N Main St Unit 1401765
- 99 Cato St
- 115 Railroad St
- 256 Privilege St
- 60 Rathbun St
- 180 Allen St Unit 104
- 60 Fairlawn Ave
- 36 Fairmount St
- 0 Diamond Hill Rd Unit 1406968
- 35 Greene St
- 10 Huntington Ave
- 685 Social St Unit 308
- 22 Dexter St
- 384 N Main St
- 39 Libbeus St
- 46 Dexter St
- 42 Dexter St
- 424 N Main St
- 404 N Main St
- 45 Libbeus St
- 376 N Main St
- 376 N Main St Unit 3R
- 376 N Main St Unit 1 Rear
- 376 N Main St Unit 2 Rear
- 21 Dexter St
- 21 Dexter St Unit 2
- 21 Dexter St Unit 1
- 38 Barton St
- 26 Barton St
- 50 Barton St
- 91 Summer St
- 115 Summer St
Your Personal Tour Guide
Ask me questions while you tour the home.