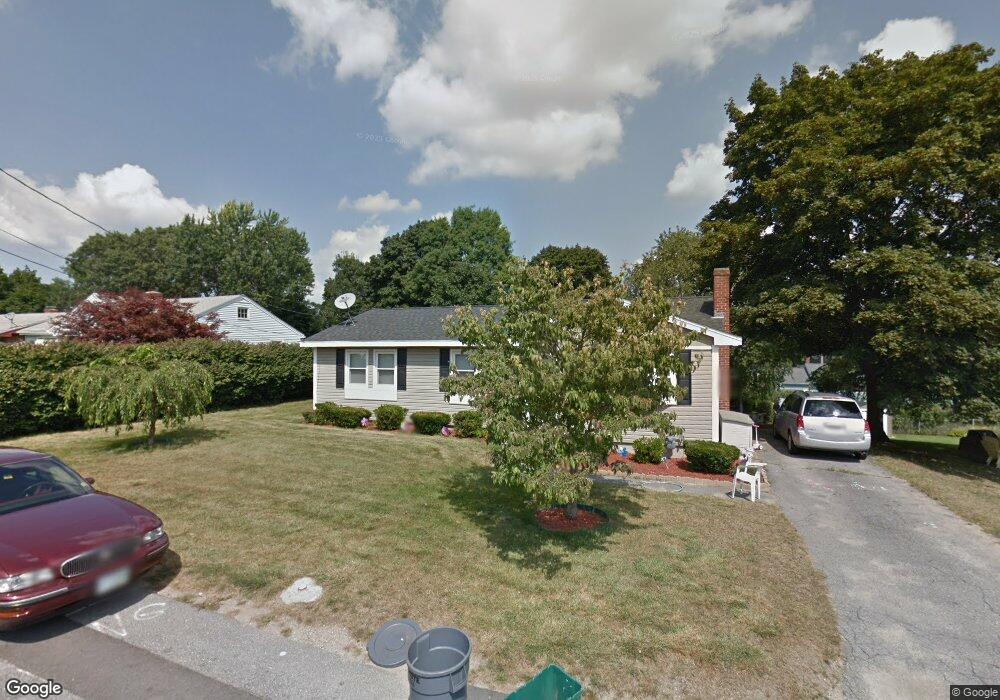
32 Dinsmore St Lowell, MA 01852
Belvidere NeighborhoodEstimated Value: $587,000 - $599,000
3
Beds
2
Baths
1,405
Sq Ft
$422/Sq Ft
Est. Value
About This Home
This home is located at 32 Dinsmore St, Lowell, MA 01852 and is currently estimated at $592,397, approximately $421 per square foot. 32 Dinsmore St is a home located in Middlesex County with nearby schools including Moody Elementary School, Abraham Lincoln Elementary School, and Greenhalge Elementary School.
Ownership History
Date
Name
Owned For
Owner Type
Purchase Details
Closed on
Mar 31, 1999
Sold by
Moriarty Daniel F and Moriarty Timothy P
Bought by
Moriarty Michael D and Prendergast Michelle
Current Estimated Value
Home Financials for this Owner
Home Financials are based on the most recent Mortgage that was taken out on this home.
Original Mortgage
$60,000
Outstanding Balance
$14,865
Interest Rate
6.78%
Mortgage Type
Purchase Money Mortgage
Estimated Equity
$577,532
Create a Home Valuation Report for This Property
The Home Valuation Report is an in-depth analysis detailing your home's value as well as a comparison with similar homes in the area
Home Values in the Area
Average Home Value in this Area
Purchase History
| Date | Buyer | Sale Price | Title Company |
|---|---|---|---|
| Moriarty Michael D | $40,000 | -- | |
| Moriarty Michael D | $40,000 | -- |
Source: Public Records
Mortgage History
| Date | Status | Borrower | Loan Amount |
|---|---|---|---|
| Open | Moriarty Michael D | $60,000 | |
| Closed | Moriarty Michael D | $60,000 |
Source: Public Records
Tax History
| Year | Tax Paid | Tax Assessment Tax Assessment Total Assessment is a certain percentage of the fair market value that is determined by local assessors to be the total taxable value of land and additions on the property. | Land | Improvement |
|---|---|---|---|---|
| 2025 | $6,342 | $552,400 | $241,400 | $311,000 |
| 2024 | $5,903 | $495,600 | $217,300 | $278,300 |
| 2023 | $5,606 | $451,400 | $188,900 | $262,500 |
| 2022 | $5,033 | $396,600 | $166,500 | $230,100 |
| 2021 | $4,873 | $362,000 | $144,800 | $217,200 |
| 2020 | $4,509 | $337,500 | $144,800 | $192,700 |
| 2019 | $4,557 | $324,600 | $138,300 | $186,300 |
| 2018 | $4,357 | $302,800 | $131,700 | $171,100 |
| 2017 | $4,167 | $279,300 | $117,000 | $162,300 |
| 2016 | $4,026 | $265,600 | $107,900 | $157,700 |
| 2015 | $4,050 | $261,600 | $107,900 | $153,700 |
| 2013 | $3,850 | $256,500 | $128,200 | $128,300 |
Source: Public Records
Map
Nearby Homes
- 43 Oheir Way
- 251 Clark Rd
- 45 Clark Rd
- 471 Butman Rd
- 42 Pentucket Ave
- 317 Nesmith St
- 313 Nesmith St
- 234 Nesmith St Unit 8
- 44 Hanks St
- 200 Rogers St Unit 6
- 206 Burnham Rd
- 42 Christian St
- 31 Floyd Ave
- 52 Christian St
- 164 Bradley St
- 100 Merrimack Ave Unit 9
- 194 River Rd
- Lots 1-12 Christian Hill Dev
- 81 Reservoir St
- 158 Concord St
Your Personal Tour Guide
Ask me questions while you tour the home.