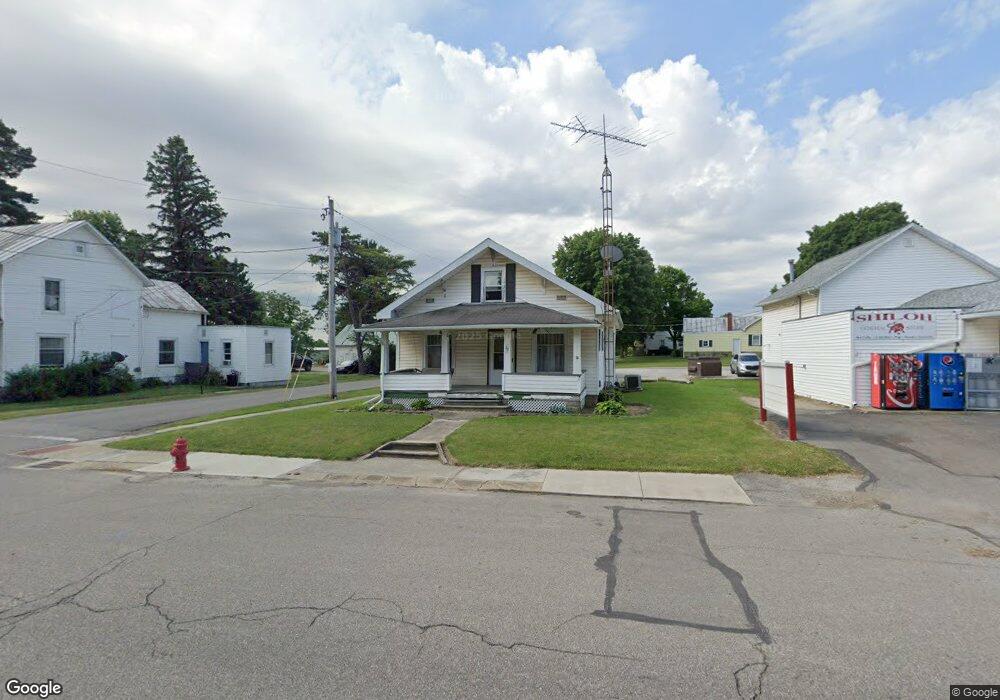
32 E Main St Shiloh, OH 44878
Estimated Value: $92,000 - $141,000
3
Beds
1
Bath
1,740
Sq Ft
$68/Sq Ft
Est. Value
About This Home
This home is located at 32 E Main St, Shiloh, OH 44878 and is currently estimated at $118,619, approximately $68 per square foot. 32 E Main St is a home located in Richland County with nearby schools including Shiloh Elementary School, Shiloh Middle School, and Plymouth High School.
Ownership History
Date
Name
Owned For
Owner Type
Purchase Details
Closed on
Nov 25, 2015
Sold by
Shepherd John E and Shepherd Amy M
Bought by
Wooster Power Equipment Inc
Current Estimated Value
Home Financials for this Owner
Home Financials are based on the most recent Mortgage that was taken out on this home.
Original Mortgage
$40,000
Outstanding Balance
$30,948
Interest Rate
3.8%
Mortgage Type
Future Advance Clause Open End Mortgage
Estimated Equity
$87,671
Purchase Details
Closed on
Nov 19, 2015
Sold by
Huston Charles W
Bought by
Shepherd John E and Shepherd Amy M
Home Financials for this Owner
Home Financials are based on the most recent Mortgage that was taken out on this home.
Original Mortgage
$40,000
Outstanding Balance
$30,948
Interest Rate
3.8%
Mortgage Type
Future Advance Clause Open End Mortgage
Estimated Equity
$87,671
Purchase Details
Closed on
Aug 17, 2010
Sold by
Huston Charles W
Bought by
Shepherd John E and Shepherd Amy M
Create a Home Valuation Report for This Property
The Home Valuation Report is an in-depth analysis detailing your home's value as well as a comparison with similar homes in the area
Purchase History
| Date | Buyer | Sale Price | Title Company |
|---|---|---|---|
| Wooster Power Equipment Inc | $40,000 | Attorney | |
| Shepherd John E | $23,000 | Attorney | |
| Shepherd John E | $55,000 | First American |
Source: Public Records
Mortgage History
| Date | Status | Borrower | Loan Amount |
|---|---|---|---|
| Open | Wooster Power Equipment Inc | $40,000 | |
| Closed | Shepherd John E | $0 |
Source: Public Records
Tax History
| Year | Tax Paid | Tax Assessment Tax Assessment Total Assessment is a certain percentage of the fair market value that is determined by local assessors to be the total taxable value of land and additions on the property. | Land | Improvement |
|---|---|---|---|---|
| 2025 | $748 | $19,470 | $2,130 | $17,340 |
| 2024 | $748 | $19,470 | $2,130 | $17,340 |
| 2023 | $768 | $19,470 | $2,130 | $17,340 |
| 2022 | $717 | $15,750 | $2,220 | $13,530 |
| 2021 | $720 | $15,750 | $2,220 | $13,530 |
| 2020 | $754 | $15,750 | $2,220 | $13,530 |
| 2019 | $666 | $13,490 | $1,880 | $11,610 |
| 2018 | $662 | $13,490 | $1,880 | $11,610 |
| 2017 | $670 | $13,490 | $1,880 | $11,610 |
| 2016 | $670 | $14,480 | $1,880 | $12,600 |
| 2015 | $670 | $14,480 | $1,880 | $12,600 |
| 2014 | $678 | $14,480 | $1,880 | $12,600 |
| 2012 | $642 | $14,480 | $1,880 | $12,600 |
Source: Public Records
Map
Nearby Homes
- 49 North St
- 0 St Rt 61- Lot 2 Unit 9061433
- 134 E Main St
- 33 E Main St
- 60 Portner St
- 4273 Old State Rd
- 6247 State Route 61 N
- 199 Sandusky St
- 2 Plum Creek Meadows
- 412 Lattimer Rd W
- 245 Lincoln Ct
- 447 Ohio 603
- 1780 US Highway 224
- 0 Countryside Dr N
- 32 Elmwood Dr
- 3245 US Hwy 250 S
- 16 W Main St
- 34 Flint St
- 16 Senior Dr
- 159 Poplar Ave
Your Personal Tour Guide
Ask me questions while you tour the home.