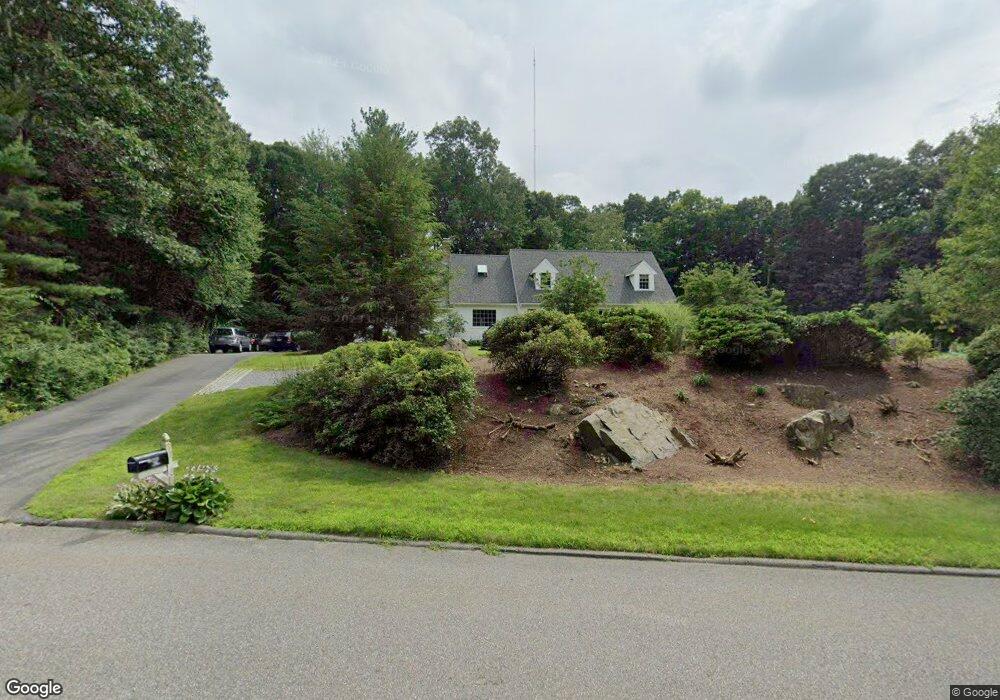
32 Ethan Allen Dr Boylston, MA 01505
Estimated Value: $860,000 - $1,088,000
4
Beds
3
Baths
2,727
Sq Ft
$364/Sq Ft
Est. Value
About This Home
This home is located at 32 Ethan Allen Dr, Boylston, MA 01505 and is currently estimated at $991,850, approximately $363 per square foot. 32 Ethan Allen Dr is a home located in Worcester County with nearby schools including Tahanto Regional High School and St Mary Elementary School.
Ownership History
Date
Name
Owned For
Owner Type
Purchase Details
Closed on
Aug 5, 2010
Sold by
Horner Nancy L and Horner Richard J
Bought by
Holgate Shannon and Holgate Heather
Current Estimated Value
Home Financials for this Owner
Home Financials are based on the most recent Mortgage that was taken out on this home.
Original Mortgage
$417,000
Interest Rate
4.73%
Mortgage Type
Purchase Money Mortgage
Purchase Details
Closed on
Jul 18, 2003
Sold by
Horner Richard J
Bought by
Horner Nancy L
Purchase Details
Closed on
Oct 15, 1999
Sold by
Fagan Thomas M and Fagan Anne
Bought by
Horner Richard J and Horner Nancy L
Purchase Details
Closed on
May 1, 1990
Sold by
Brook Rlty Constr Co
Bought by
Fagan Thomas M
Create a Home Valuation Report for This Property
The Home Valuation Report is an in-depth analysis detailing your home's value as well as a comparison with similar homes in the area
Home Values in the Area
Average Home Value in this Area
Purchase History
| Date | Buyer | Sale Price | Title Company |
|---|---|---|---|
| Holgate Shannon | $475,000 | -- | |
| Horner Nancy L | -- | -- | |
| Horner Richard J | $380,000 | -- | |
| Fagan Thomas M | $315,000 | -- |
Source: Public Records
Mortgage History
| Date | Status | Borrower | Loan Amount |
|---|---|---|---|
| Open | Fagan Thomas M | $412,000 | |
| Closed | Holgate Shannon | $417,000 | |
| Previous Owner | Fagan Thomas M | $30,000 | |
| Previous Owner | Fagan Thomas M | $20,000 |
Source: Public Records
Tax History Compared to Growth
Tax History
| Year | Tax Paid | Tax Assessment Tax Assessment Total Assessment is a certain percentage of the fair market value that is determined by local assessors to be the total taxable value of land and additions on the property. | Land | Improvement |
|---|---|---|---|---|
| 2025 | $13,141 | $950,200 | $222,600 | $727,600 |
| 2024 | $10,884 | $788,100 | $222,600 | $565,500 |
| 2023 | $11,712 | $813,300 | $195,000 | $618,300 |
| 2022 | $9,688 | $611,600 | $195,000 | $416,600 |
| 2021 | $10,244 | $603,300 | $195,000 | $408,300 |
| 2020 | $9,757 | $589,900 | $194,600 | $395,300 |
| 2019 | $9,135 | $569,500 | $193,000 | $376,500 |
| 2018 | $5,213 | $551,800 | $193,000 | $358,800 |
| 2017 | $8,895 | $551,800 | $193,000 | $358,800 |
| 2016 | $8,661 | $529,100 | $173,000 | $356,100 |
| 2015 | $9,212 | $529,100 | $173,000 | $356,100 |
| 2014 | $8,679 | $499,100 | $159,800 | $339,300 |
Source: Public Records
Map
Nearby Homes
- 18 Bay Path Dr
- 48 Perry Rd
- 70 Colonial Dr
- 5 Sewall St Unit 259
- 21 School St
- 20 Rawson Hill Dr
- 106 Reservoir St
- 2 Harmony Ln Unit 1
- 7 Oakwood Cir Unit 15
- 1 Harmony Ln Unit 4
- 8 Burkhardt Cir Unit 8
- 4 Harmony Ln Unit 2
- 207 Edgebrook Dr Unit 2-11
- 217 Edgebrook Dr
- 11 Cranbrook Rd
- 7-11 Reservoir St
- 25 Castle Rd
- 26 W Temple St
- 279 Sewall St Unit 279
- 281 Sewall St Unit 281
- 22 Ethan Allen Dr
- 39 Adams St
- 29 Adams St
- 25 Ethan Allen Dr
- 33 Ethan Allen Dr
- 21 Adams St
- 11 Ethan Allen Dr
- 52 Ethan Allen Dr
- 46 Adams St
- 49 Ethan Allen Dr
- 5 Columbus Rd
- 3 Longfellow Way
- 491 Cross St
- 487 Cross St
- 60 Ethan Allen Dr
- 4 Columbus Rd
- 54 Adams St
- 59 Ethan Allen Dr
- 483 Cross St
- 495 Cross St