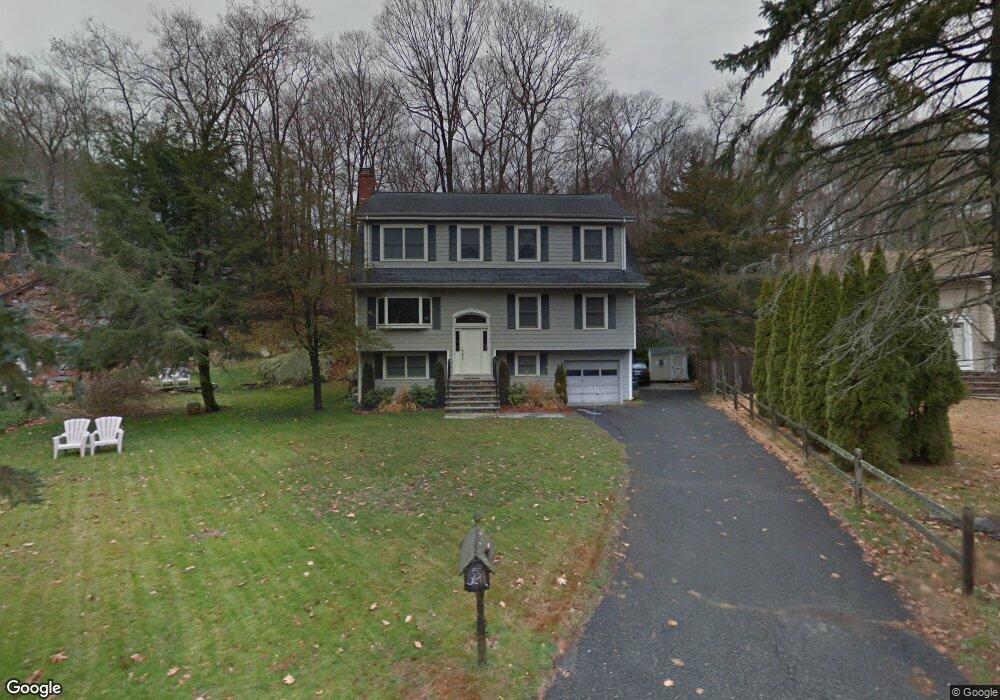
32 Fado Ln Cos Cob, CT 06807
Estimated Value: $2,069,000 - $7,294,176
4
Beds
4
Baths
3,224
Sq Ft
$1,079/Sq Ft
Est. Value
About This Home
This home is located at 32 Fado Ln, Cos Cob, CT 06807 and is currently estimated at $3,480,044, approximately $1,079 per square foot. 32 Fado Ln is a home located in Fairfield County with nearby schools including North Mianus School, Eastern Middle School, and Greenwich High School.
Ownership History
Date
Name
Owned For
Owner Type
Purchase Details
Closed on
Jun 14, 2012
Sold by
Es Ventures One Llc
Bought by
Gilder Mark and Gilder Karen M
Current Estimated Value
Home Financials for this Owner
Home Financials are based on the most recent Mortgage that was taken out on this home.
Original Mortgage
$574,500
Interest Rate
3.85%
Mortgage Type
Adjustable Rate Mortgage/ARM
Purchase Details
Closed on
Dec 22, 1995
Sold by
Chang Johnny S and Chang Kin Ming
Bought by
Gilder Mark and Gilder Karen Mcgee
Create a Home Valuation Report for This Property
The Home Valuation Report is an in-depth analysis detailing your home's value as well as a comparison with similar homes in the area
Home Values in the Area
Average Home Value in this Area
Purchase History
| Date | Buyer | Sale Price | Title Company |
|---|---|---|---|
| Gilder Mark | $3,700,000 | -- | |
| Gilder Mark | $340,000 | -- |
Source: Public Records
Mortgage History
| Date | Status | Borrower | Loan Amount |
|---|---|---|---|
| Open | Gilder Mark | $600,000 | |
| Closed | Gilder Mark | $566,215 | |
| Closed | Gilder Mark | $574,500 | |
| Previous Owner | Gilder Mark | $417,000 |
Source: Public Records
Tax History Compared to Growth
Tax History
| Year | Tax Paid | Tax Assessment Tax Assessment Total Assessment is a certain percentage of the fair market value that is determined by local assessors to be the total taxable value of land and additions on the property. | Land | Improvement |
|---|---|---|---|---|
| 2025 | $9,814 | $794,080 | $463,050 | $331,030 |
| 2024 | $9,478 | $794,080 | $463,050 | $331,030 |
| 2023 | $9,240 | $794,080 | $463,050 | $331,030 |
| 2022 | $9,156 | $794,080 | $463,050 | $331,030 |
| 2021 | $10,243 | $850,710 | $443,450 | $407,260 |
| 2020 | $10,226 | $850,710 | $443,450 | $407,260 |
| 2019 | $10,328 | $850,710 | $443,450 | $407,260 |
| 2018 | $9,825 | $827,680 | $443,450 | $384,230 |
| 2017 | $9,948 | $827,680 | $443,450 | $384,230 |
| 2016 | $9,791 | $827,680 | $443,450 | $384,230 |
| 2015 | $8,328 | $698,390 | $455,070 | $243,320 |
| 2014 | $8,119 | $698,390 | $455,070 | $243,320 |
Source: Public Records
Map
Nearby Homes
- 6 Fox Hollow Ln
- 333 Palmer Hill Rd Unit 2E
- 116 Hillcrest Park Rd
- 9 Walnut St
- 681 River Rd
- 28 N Ridge Rd
- 10 Tomahawk Ln
- 88 Starin Dr
- 45 Sunshine Ave
- 84 Havemeyer Ln
- 33 Halsey Dr
- 67 Cos Cob Ave
- 75 W Glen Dr
- 77 Havemeyer Ln Unit 420
- 24 Harold St Unit E
- 25 Hoover Rd
- 3 Finney Knoll Ln
- 136 Knobloch Ln
- 88 Valleywood Rd
- 18 Sound Beach Ave