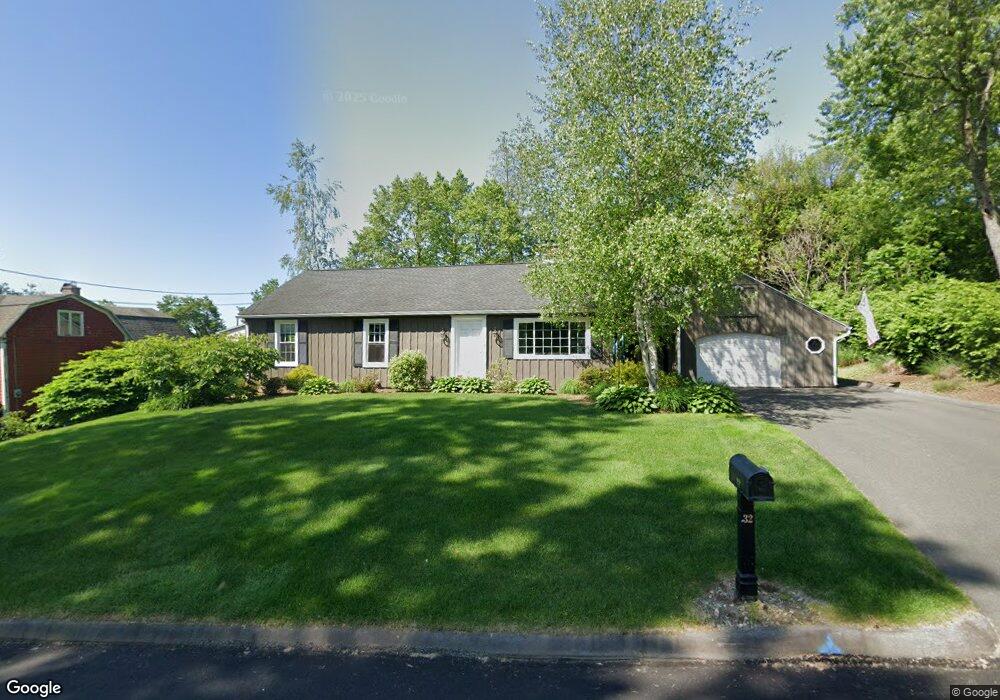
32 Fairview St East Longmeadow, MA 01028
Estimated Value: $368,298 - $400,000
3
Beds
1
Bath
1,384
Sq Ft
$276/Sq Ft
Est. Value
About This Home
This home is located at 32 Fairview St, East Longmeadow, MA 01028 and is currently estimated at $382,575, approximately $276 per square foot. 32 Fairview St is a home located in Hampden County with nearby schools including Meadowbrook Elementary School, Birchland Park Middle School, and East Longmeadow High School.
Ownership History
Date
Name
Owned For
Owner Type
Purchase Details
Closed on
Jul 7, 2025
Sold by
Chapdelaine James M and Chapdelaine Darleen
Bought by
Doe Heather L and Litz Scott
Current Estimated Value
Home Financials for this Owner
Home Financials are based on the most recent Mortgage that was taken out on this home.
Original Mortgage
$382,936
Outstanding Balance
$382,289
Interest Rate
6.86%
Mortgage Type
FHA
Estimated Equity
$286
Purchase Details
Closed on
Jan 3, 2019
Sold by
Chapdelaine Elizabeth J
Bought by
Chapdelaine James M and Chapdelaine Darleen
Create a Home Valuation Report for This Property
The Home Valuation Report is an in-depth analysis detailing your home's value as well as a comparison with similar homes in the area
Home Values in the Area
Average Home Value in this Area
Purchase History
| Date | Buyer | Sale Price | Title Company |
|---|---|---|---|
| Doe Heather L | $390,000 | -- | |
| Doe Heather L | $390,000 | -- | |
| Chapdelaine James M | $220,000 | -- | |
| Chapdelaine James M | $220,000 | -- |
Source: Public Records
Mortgage History
| Date | Status | Borrower | Loan Amount |
|---|---|---|---|
| Open | Doe Heather L | $382,936 | |
| Closed | Doe Heather L | $382,936 |
Source: Public Records
Tax History Compared to Growth
Tax History
| Year | Tax Paid | Tax Assessment Tax Assessment Total Assessment is a certain percentage of the fair market value that is determined by local assessors to be the total taxable value of land and additions on the property. | Land | Improvement |
|---|---|---|---|---|
| 2025 | $5,398 | $292,100 | $112,900 | $179,200 |
| 2024 | $5,210 | $281,000 | $112,900 | $168,100 |
| 2023 | $4,977 | $259,200 | $102,600 | $156,600 |
| 2022 | $4,803 | $236,700 | $93,200 | $143,500 |
| 2021 | $4,717 | $224,000 | $86,400 | $137,600 |
| 2020 | $4,599 | $220,700 | $86,400 | $134,300 |
| 2019 | $4,406 | $214,400 | $83,800 | $130,600 |
| 2018 | $4,284 | $204,600 | $83,800 | $120,800 |
| 2017 | $4,090 | $196,900 | $81,800 | $115,100 |
| 2016 | $4,080 | $193,200 | $79,400 | $113,800 |
| 2015 | $4,003 | $193,200 | $79,400 | $113,800 |
Source: Public Records
Map
Nearby Homes
- 19 Fairview St
- 17 Elizabeth St
- 2 Melody Ln
- 103 Day Ave
- 158 Elm St
- 58 Baymor Dr
- 20 Maynard St
- 0 Donald Ave
- Lot 13 Farmer Cir
- Lot 21 Farmer Cir
- 131 Endicott St
- 131 Maple St
- 1 Jeffrey Ln
- LOT 18 Farmer Cir
- Lot 24 Happy Acres Ln
- 77 Gates Ave
- 31 Melwood Ave
- 26-28 Moulton St
- 11 Park Place
- 211 W Allen Ridge Rd