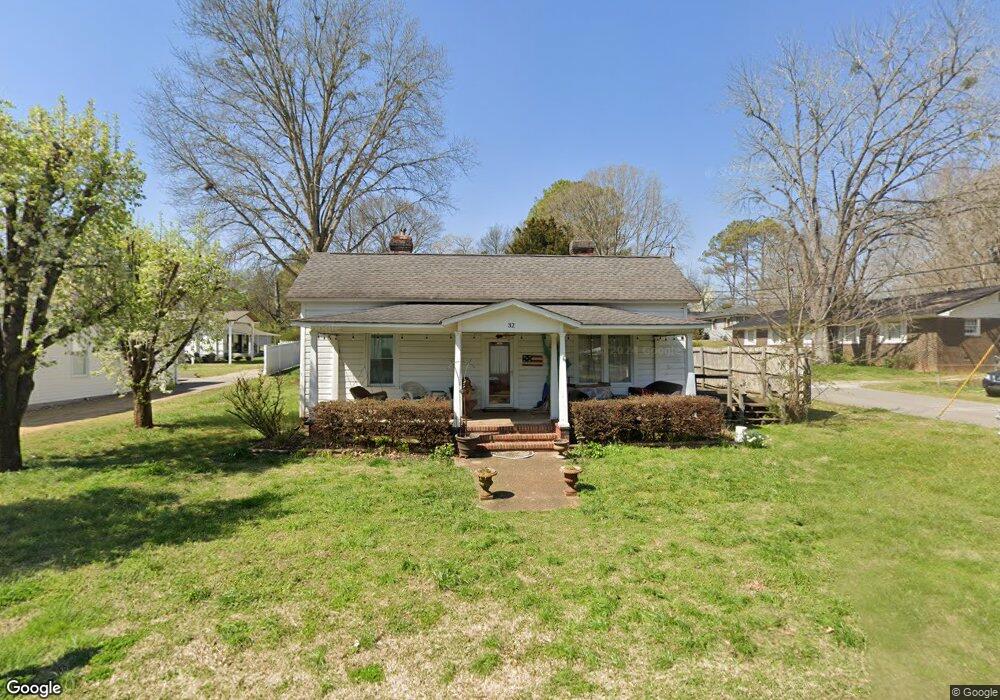
32 Fannin St Cave Spring, GA 30124
Estimated Value: $186,000 - $224,000
--
Bed
--
Bath
1,865
Sq Ft
$108/Sq Ft
Est. Value
About This Home
This home is located at 32 Fannin St, Cave Spring, GA 30124 and is currently estimated at $201,230, approximately $107 per square foot. 32 Fannin St is a home located in Floyd County with nearby schools including Coosa Middle School and Coosa High School.
Ownership History
Date
Name
Owned For
Owner Type
Purchase Details
Closed on
May 30, 2003
Sold by
Medlin Daniel W and Medlin Helen C
Bought by
Watson Robert T and Watson Kathi A
Current Estimated Value
Purchase Details
Closed on
May 30, 1995
Sold by
Anthony Timothy J and Anthony Ginger
Bought by
Medlin Daniel W and Medlin Helen C
Purchase Details
Closed on
Jan 25, 1988
Sold by
Brannon C S
Bought by
Anthony Timothy J and Anthony Ginger
Purchase Details
Closed on
Oct 26, 1965
Sold by
Metcalf Alfred Reynolds
Bought by
Brannon C S
Purchase Details
Closed on
Aug 10, 1965
Bought by
P and R
Purchase Details
Closed on
Mar 24, 1961
Sold by
Metcalf J H
Bought by
Metcalf Alfred Reynolds
Purchase Details
Closed on
Jan 1, 1925
Sold by
Chapman Emmie
Bought by
Metcalf J H
Purchase Details
Closed on
Jan 2, 1901
Sold by
Metcalf Minnie Russell
Bought by
Chapman Emmie
Purchase Details
Closed on
Jan 1, 1901
Bought by
Metcalf Minnie Russell
Create a Home Valuation Report for This Property
The Home Valuation Report is an in-depth analysis detailing your home's value as well as a comparison with similar homes in the area
Home Values in the Area
Average Home Value in this Area
Purchase History
| Date | Buyer | Sale Price | Title Company |
|---|---|---|---|
| Watson Robert T | $75,000 | -- | |
| Medlin Daniel W | $50,000 | -- | |
| Anthony Timothy J | $28,000 | -- | |
| Brannon C S | $3,300 | -- | |
| P | -- | -- | |
| Metcalf Alfred Reynolds | -- | -- | |
| Metcalf J H | -- | -- | |
| Chapman Emmie | -- | -- | |
| Metcalf Minnie Russell | -- | -- |
Source: Public Records
Tax History Compared to Growth
Tax History
| Year | Tax Paid | Tax Assessment Tax Assessment Total Assessment is a certain percentage of the fair market value that is determined by local assessors to be the total taxable value of land and additions on the property. | Land | Improvement |
|---|---|---|---|---|
| 2024 | $2,190 | $77,894 | $3,308 | $74,586 |
| 2023 | $0 | $72,605 | $3,008 | $69,597 |
| 2022 | $1,292 | $59,695 | $2,406 | $57,289 |
| 2021 | $1,134 | $49,822 | $2,406 | $47,416 |
| 2020 | $1,078 | $46,334 | $1,804 | $44,530 |
| 2019 | $1,015 | $43,480 | $1,804 | $41,676 |
| 2018 | $965 | $40,627 | $1,804 | $38,823 |
| 2017 | $936 | $38,929 | $1,804 | $37,125 |
| 2016 | $925 | $37,737 | $1,800 | $35,937 |
| 2015 | $908 | $37,737 | $1,800 | $35,937 |
| 2014 | $908 | $37,737 | $1,800 | $35,937 |
Source: Public Records
Map
Nearby Homes
- 22 River St SW
- 104 Fincher St
- 57 Mill St
- 7 Herschel Mize Dr SW
- 7 Herschel Mize Dr
- 5677 Fosters Mill Rd SW
- 0 Mill Rd Unit 10629874
- 0 Mill Rd Unit 7670319
- 5598 Fosters Mill Rd
- 10 Ridge Rd SW
- 8876 Cave Spring Rd SW
- 8876 Cave Spring
- 0 Melson Rd SW Unit 7676052
- 0 Melson Rd SW Unit 10636997
- 907 Gadsden Rd SW
- 424 Michael Blvd
- 383 Valley Grove Rd
- 100 Lee Ave
- 0 McGee Bend Rd SW Unit 10351960
- 2053 Buttermilk Rd SW