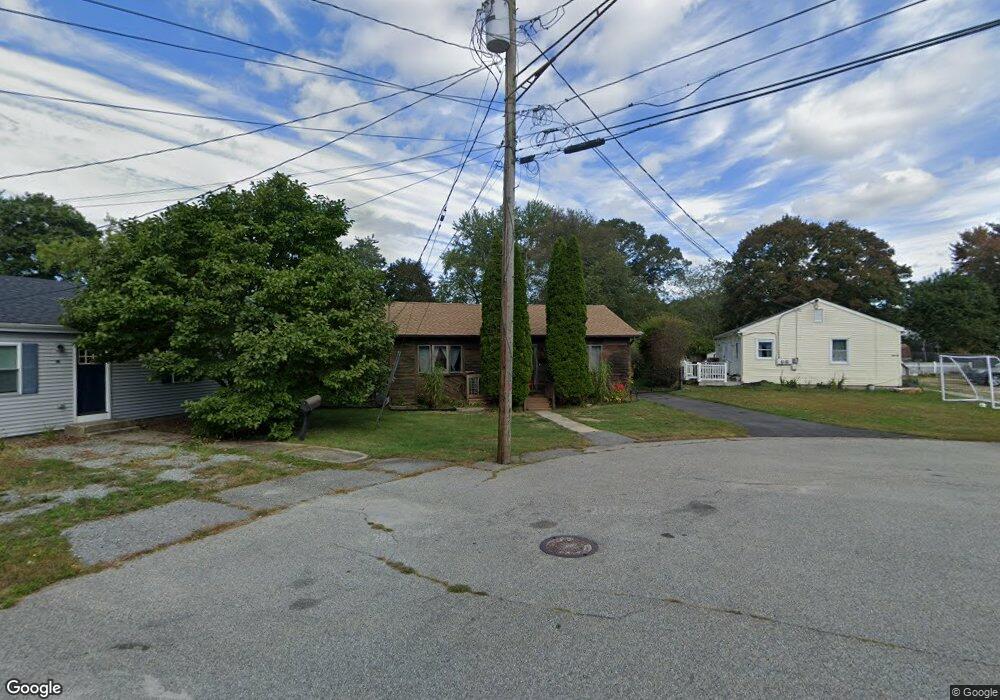
32 Flint Ct Groton, CT 06340
Poquonock Bridge NeighborhoodEstimated Value: $284,000 - $323,000
3
Beds
2
Baths
1,205
Sq Ft
$256/Sq Ft
Est. Value
About This Home
This home is located at 32 Flint Ct, Groton, CT 06340 and is currently estimated at $308,448, approximately $255 per square foot. 32 Flint Ct is a home located in New London County with nearby schools including Groton Middle School, Robert E. Fitch High School, and Sacred Heart School.
Ownership History
Date
Name
Owned For
Owner Type
Purchase Details
Closed on
Jul 1, 1998
Sold by
Gosline Eugene P
Bought by
Albee Lucien G
Current Estimated Value
Home Financials for this Owner
Home Financials are based on the most recent Mortgage that was taken out on this home.
Original Mortgage
$74,900
Interest Rate
7.04%
Mortgage Type
Unknown
Create a Home Valuation Report for This Property
The Home Valuation Report is an in-depth analysis detailing your home's value as well as a comparison with similar homes in the area
Home Values in the Area
Average Home Value in this Area
Purchase History
| Date | Buyer | Sale Price | Title Company |
|---|---|---|---|
| Albee Lucien G | $77,000 | -- |
Source: Public Records
Mortgage History
| Date | Status | Borrower | Loan Amount |
|---|---|---|---|
| Open | Albee Lucien G | $133,200 | |
| Closed | Albee Lucien G | $40,000 | |
| Closed | Albee Lucien G | $74,900 | |
| Previous Owner | Albee Lucien G | $104,110 |
Source: Public Records
Tax History Compared to Growth
Tax History
| Year | Tax Paid | Tax Assessment Tax Assessment Total Assessment is a certain percentage of the fair market value that is determined by local assessors to be the total taxable value of land and additions on the property. | Land | Improvement |
|---|---|---|---|---|
| 2025 | $3,834 | $129,920 | $56,616 | $73,304 |
| 2024 | $3,609 | $129,920 | $56,616 | $73,304 |
| 2023 | $3,538 | $129,920 | $25,200 | $104,720 |
| 2022 | $3,456 | $129,920 | $25,200 | $104,720 |
| 2021 | $2,982 | $91,840 | $28,000 | $63,840 |
| 2020 | $2,904 | $91,840 | $28,000 | $63,840 |
| 2019 | $2,797 | $91,840 | $28,000 | $63,840 |
| 2018 | $2,768 | $91,840 | $28,000 | $63,840 |
| 2017 | $2,696 | $91,840 | $28,000 | $63,840 |
| 2016 | $2,891 | $102,970 | $43,400 | $59,570 |
| 2015 | $2,780 | $102,970 | $43,400 | $59,570 |
| 2014 | $2,706 | $102,970 | $43,400 | $59,570 |
Source: Public Records
Map
Nearby Homes