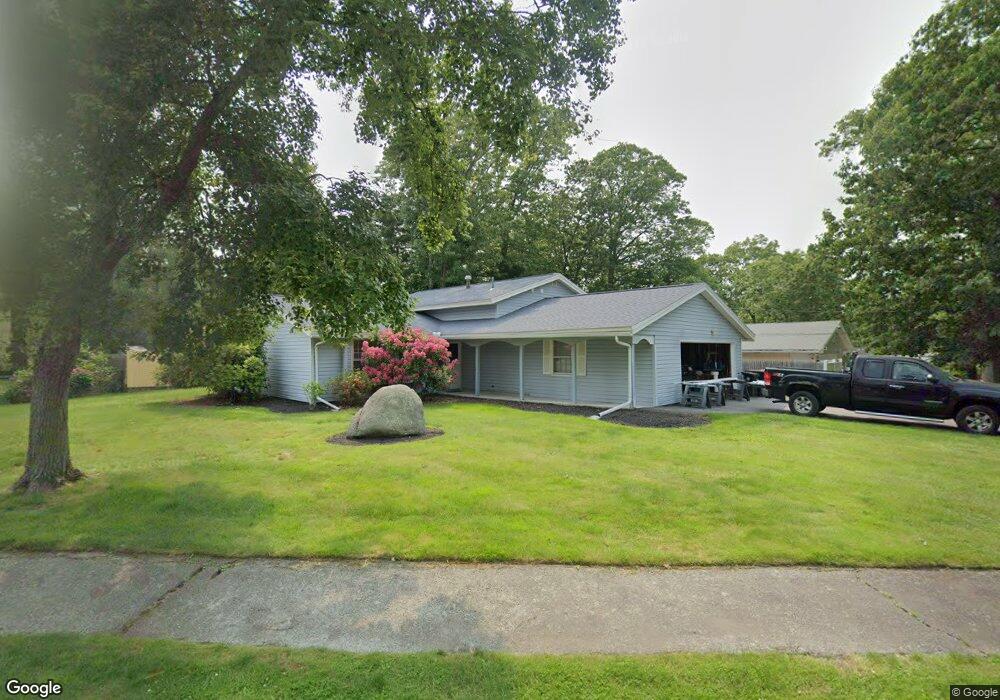
32 Flint Rd Brockton, MA 02302
Estimated Value: $507,435 - $602,000
3
Beds
3
Baths
1,519
Sq Ft
$362/Sq Ft
Est. Value
About This Home
This home is located at 32 Flint Rd, Brockton, MA 02302 and is currently estimated at $550,359, approximately $362 per square foot. 32 Flint Rd is a home located in Plymouth County with nearby schools including Gilmore Elementary School, Davis K-8 School, and John F. Kennedy Elementary School.
Ownership History
Date
Name
Owned For
Owner Type
Purchase Details
Closed on
Aug 5, 2004
Sold by
Sloane Christine T
Bought by
Sloane Ft
Current Estimated Value
Purchase Details
Closed on
Sep 28, 1988
Sold by
Pappas James V
Bought by
Sloane Christine T
Create a Home Valuation Report for This Property
The Home Valuation Report is an in-depth analysis detailing your home's value as well as a comparison with similar homes in the area
Purchase History
| Date | Buyer | Sale Price | Title Company |
|---|---|---|---|
| Sloane Ft | -- | -- | |
| Sloane Christine T | $153,900 | -- |
Source: Public Records
Mortgage History
| Date | Status | Borrower | Loan Amount |
|---|---|---|---|
| Open | Sloane Christine T | $134,000 | |
| Closed | Sloane Christine T | $152,000 | |
| Closed | Sloane Christine T | $35,000 | |
| Previous Owner | Sloane Christine T | $150,000 |
Source: Public Records
Tax History
| Year | Tax Paid | Tax Assessment Tax Assessment Total Assessment is a certain percentage of the fair market value that is determined by local assessors to be the total taxable value of land and additions on the property. | Land | Improvement |
|---|---|---|---|---|
| 2025 | $5,971 | $493,100 | $161,900 | $331,200 |
| 2024 | $5,634 | $468,700 | $161,900 | $306,800 |
| 2023 | $5,219 | $402,100 | $112,300 | $289,800 |
| 2022 | $4,831 | $345,800 | $102,100 | $243,700 |
| 2021 | $4,830 | $333,100 | $95,300 | $237,800 |
| 2020 | $4,903 | $323,600 | $83,400 | $240,200 |
| 2019 | $5,265 | $338,800 | $79,800 | $259,000 |
| 2018 | $4,490 | $279,600 | $79,800 | $199,800 |
| 2017 | $4,168 | $258,900 | $79,800 | $179,100 |
| 2016 | $3,885 | $223,800 | $76,100 | $147,700 |
| 2015 | $3,634 | $200,200 | $76,100 | $124,100 |
| 2014 | $3,778 | $208,400 | $76,100 | $132,300 |
Source: Public Records
Map
Nearby Homes
- 23 Dondi Rd
- 118 Deanna Rd
- 578 Plain St
- 15 Wachusetts Rd
- 12 Paulin Ave
- 1 Thomas Cir
- 549 Summer St
- 111 Riverview St
- 463 Pleasant St
- 41 Riverview St
- 383 Summer St
- 55 Marjan Dr
- 100 Concord St
- 15 Longworth Ave Unit 226
- 9 Longworth Ave Unit 135
- 9 Longworth Ave Unit 113
- 25 Longworth Ave Unit 4
- 35 Longworth Ave Unit 25
- 31 Friendship Dr
- 10 Colleen Way
Your Personal Tour Guide
Ask me questions while you tour the home.