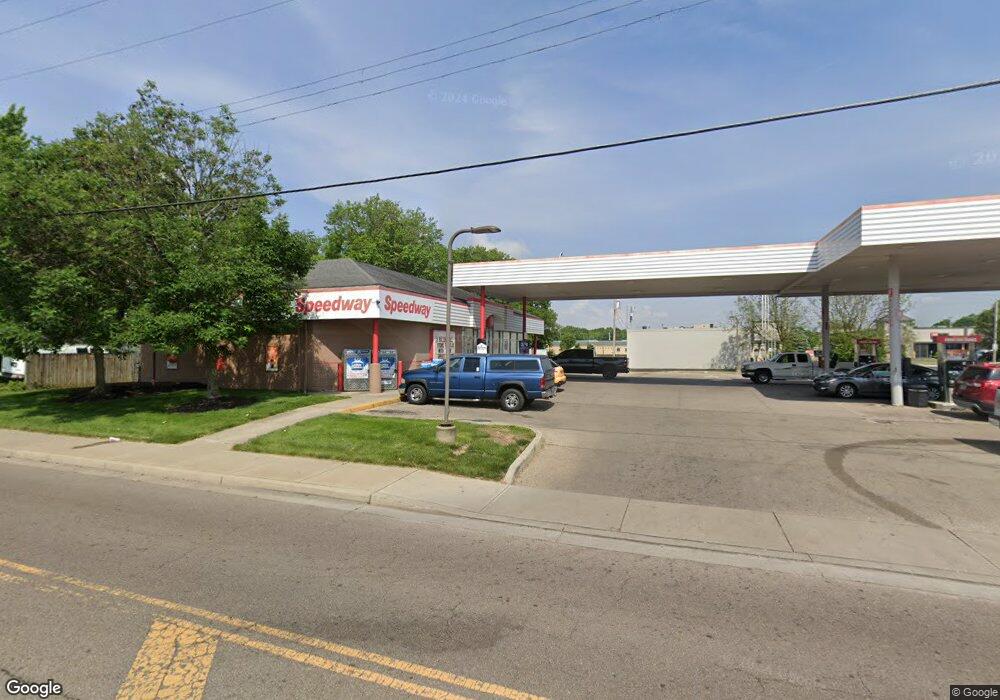
Estimated Value: $365,513
--
Bed
--
Bath
--
Sq Ft
9,148
Sq Ft Lot
About This Home
This home is located at 32 Foss Way, Troy, OH 45373 and is currently estimated at $365,513. 32 Foss Way is a home located in Miami County with nearby schools including Cookson Elementary School, Troy Junior High School, and Van Cleve Elementary School.
Ownership History
Date
Name
Owned For
Owner Type
Purchase Details
Closed on
Sep 5, 2023
Sold by
Fdh Investments Llc
Bought by
Iles Don Evan and Iles Daniell
Current Estimated Value
Purchase Details
Closed on
Jun 29, 2023
Sold by
Gols Investment Group Llc
Bought by
Fdh Investments Llc
Purchase Details
Closed on
Mar 29, 2022
Sold by
Fdh Investments Llc
Bought by
Gols Investment Group Llc
Purchase Details
Closed on
May 14, 2018
Sold by
Tag Property Group Llc
Bought by
Fdh Investments Llc
Purchase Details
Closed on
Jun 7, 2007
Sold by
Grove Trent Adam
Bought by
Tag Property Group Llc
Purchase Details
Closed on
Mar 18, 2004
Sold by
Grove Brown Tricia A
Bought by
Grove Trent Adam
Purchase Details
Closed on
Jun 30, 2000
Sold by
Grove Todd A and Grove Tricia A
Bought by
Grove Tricia A
Purchase Details
Closed on
Jan 1, 1990
Bought by
Haack Dennis A
Create a Home Valuation Report for This Property
The Home Valuation Report is an in-depth analysis detailing your home's value as well as a comparison with similar homes in the area
Home Values in the Area
Average Home Value in this Area
Purchase History
| Date | Buyer | Sale Price | Title Company |
|---|---|---|---|
| Iles Don Evan | $340,000 | None Listed On Document | |
| Fdh Investments Llc | $200,000 | None Listed On Document | |
| Gols Investment Group Llc | -- | None Listed On Document | |
| Fdh Investments Llc | $15,000 | -- | |
| Tag Property Group Llc | -- | -- | |
| Grove Trent Adam | -- | -- | |
| Grove Tricia A | -- | -- | |
| Haack Dennis A | -- | -- |
Source: Public Records
Tax History Compared to Growth
Tax History
| Year | Tax Paid | Tax Assessment Tax Assessment Total Assessment is a certain percentage of the fair market value that is determined by local assessors to be the total taxable value of land and additions on the property. | Land | Improvement |
|---|---|---|---|---|
| 2024 | $352 | $4,970 | $4,970 | $0 |
| 2023 | $352 | $4,970 | $4,970 | $0 |
| 2022 | $293 | $4,970 | $4,970 | $0 |
| 2021 | $296 | $4,970 | $4,970 | $0 |
| 2020 | $293 | $4,970 | $4,970 | $0 |
| 2019 | $294 | $4,970 | $4,970 | $0 |
| 2018 | $296 | $4,970 | $4,970 | $0 |
| 2017 | $104 | $1,370 | $1,370 | $0 |
| 2016 | $103 | $1,370 | $1,370 | $0 |
| 2015 | $322 | $14,350 | $5,530 | $8,820 |
| 2014 | $322 | $5,530 | $5,530 | $0 |
| 2013 | $785 | $14,350 | $5,530 | $8,820 |
Source: Public Records
Map
Nearby Homes
- 708 N Market St
- 731 Michigan Ave
- 190 Robin Hood Ln
- 605 Ohio Ave
- 1075 Crestview Dr
- 221 Finsbury Ln
- 755 W Bentley Cir
- 720 Sherwood Dr
- 838 W Bentley Cir
- 1160 Waterloo St
- 813 W Bentley Cir
- 1164 Waterloo St
- 1137 Auburn St
- 429 Forrest Ln
- 1188 E Bentley Cir
- 1329 Lee Rd
- 922 Haverhill Dr
- 1002 Stonyridge Ave
- 680 Loxley Ln
- 839 Governors Rd
