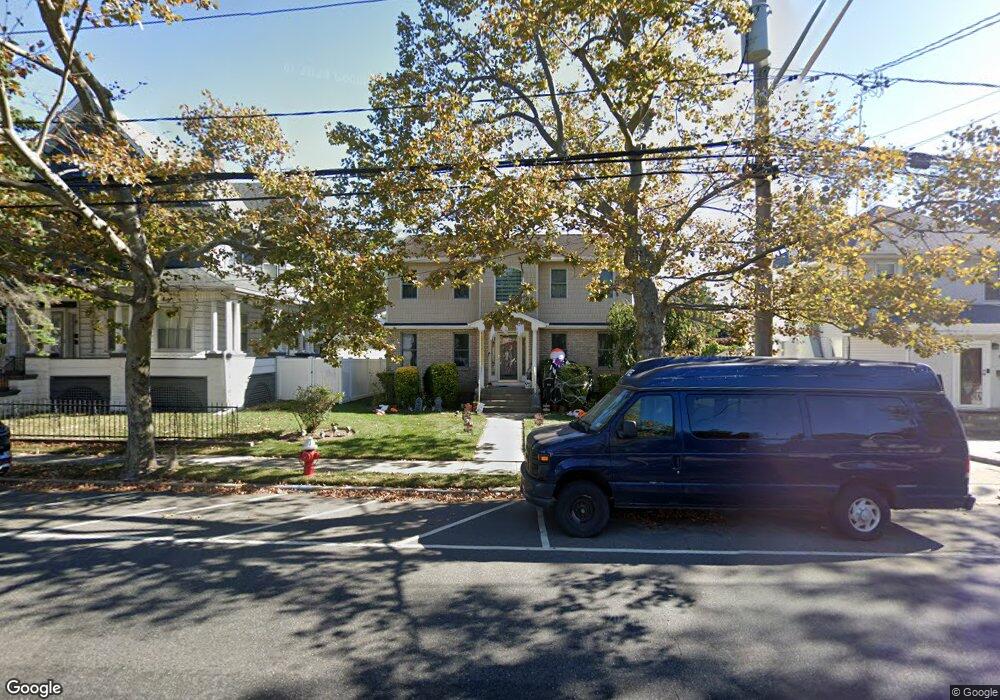
32 Franklin Ave Unit A Lynbrook, NY 11563
Estimated Value: $738,012 - $776,000
About This Home
This home is located at 32 Franklin Ave Unit A, Lynbrook, NY 11563 and is currently estimated at $757,006, approximately $635 per square foot. 32 Franklin Ave Unit A is a home located in Nassau County with nearby schools including Davison Avenue Intermediate School, Maurice W. Downing Primary K-2 School, and Howard T Herber Middle School.
Ownership History
We collect this data history from publicly available records. To have your information removed, we recommend requesting removal directly through your county’s website.
Purchase Details
Purchase Details
Purchase Details
Home Values in the Area
Average Home Value in this Area
Purchase History
We collect this data history from publicly available records. To have your information removed, we recommend requesting removal directly through your county’s website.
| Date | Buyer | Sale Price | Title Company |
|---|---|---|---|
| $780,000 | Chicago Title Insurance Co | ||
| $175,000 | -- | ||
| -- | -- |
Tax History
We collect this data history from publicly available records. To have your information removed, we recommend requesting removal directly through your county’s website.
| Year | Tax Paid | Tax Assessment Tax Assessment Total Assessment is a certain percentage of the fair market value that is determined by local assessors to be the total taxable value of land and additions on the property. | Land | Improvement |
|---|---|---|---|---|
| 2026 | $9,652 | $412 | $178 | $234 |
| 2025 | $9,652 | $389 | $168 | $221 |
| 2024 | $2,983 | $412 | $178 | $234 |
| 2023 | $9,203 | $412 | $178 | $234 |
| 2022 | $9,330 | $412 | $178 | $234 |
| 2021 | $9,092 | $389 | $168 | $221 |
| 2020 | $8,886 | $571 | $456 | $115 |
| 2019 | $2,702 | $571 | $409 | $162 |
| 2018 | $5,576 | $636 | $0 | $0 |
| 2017 | $5,654 | $636 | $456 | $180 |
| 2016 | $8,450 | $636 | $456 | $180 |
| 2015 | $2,633 | $636 | $456 | $180 |
| 2014 | $2,633 | $636 | $456 | $180 |
| 2013 | $2,474 | $636 | $456 | $180 |
Map
- 49 Hempstead Ave
- 4 Nassau Blvd
- 20 Nassau Blvd
- 63 Central Ave
- 2 Birch Rd
- 90 Pearsall Ave
- 77 Hendrickson Ave
- 81 Stuart St
- 35 Hanson Place
- 76 Davison Ave
- 31 Carol St
- 43 Nassau Blvd
- 89 Lexington Ave
- 408 Vincent Ave
- 255 Rolling St
- 153 Davison Ave
- 138 Chestnut St
- 244 Rolling St
- 196 Central Ave
- 36 Lafayette Ave
- 30 Franklin Ave
- 30 Franklin Ave
- 28 Franklin Ave
- 28 Franklin Ave
- 34 Franklin Ave Unit 34 B
- 34 Franklin Ave
- 34 Franklin Ave
- 26 Franklin Ave
- 11 Dalston Cir
- 24 Franklin Ave
- 33 Franklin Ave
- 33 Franklin Ave
- 1 Dalston Cir
- 35 Franklin Ave
- 31 Franklin Ave
- 7 Dalston Cir
- 29 Franklin Ave Unit 2
- 29 Franklin Ave
- 25 Franklin Ave
- 3 Dalston Cir
Ask me questions while you tour the home.