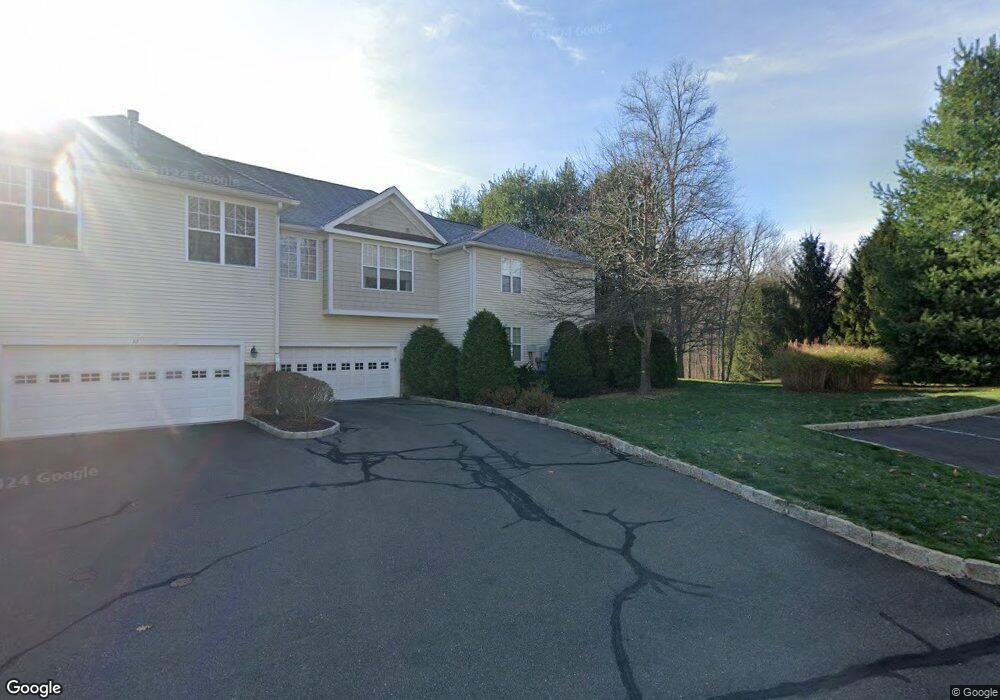
32 Franklin Ct Newtown, CT 06470
Estimated Value: $568,000 - $654,000
2
Beds
3
Baths
1,940
Sq Ft
$306/Sq Ft
Est. Value
About This Home
This home is located at 32 Franklin Ct, Newtown, CT 06470 and is currently estimated at $594,270, approximately $306 per square foot. 32 Franklin Ct is a home located in Fairfield County with nearby schools including Reed Intermediate School, Newtown Middle School, and Newtown High School.
Ownership History
Date
Name
Owned For
Owner Type
Purchase Details
Closed on
Sep 11, 2024
Sold by
Dangelo Michael J and Dangelo Ann C
Bought by
Dangelo T T and Dangelo Maselli
Current Estimated Value
Purchase Details
Closed on
Jun 3, 2014
Sold by
Jessica D Rizzo Ft
Bought by
Dangelo Michael J and Dangelo Joann C
Purchase Details
Closed on
Nov 29, 2012
Sold by
Rizzo Michael P and Rizzo Jessica
Bought by
Rizzo Jessica D and Rizzo Michael P
Purchase Details
Closed on
Jun 29, 2011
Sold by
Nepple Vern D and Nepple Rosemarie
Bought by
Rizzo Michael P and Rizzo Jessica D
Home Financials for this Owner
Home Financials are based on the most recent Mortgage that was taken out on this home.
Original Mortgage
$250,000
Interest Rate
4.6%
Create a Home Valuation Report for This Property
The Home Valuation Report is an in-depth analysis detailing your home's value as well as a comparison with similar homes in the area
Home Values in the Area
Average Home Value in this Area
Purchase History
| Date | Buyer | Sale Price | Title Company |
|---|---|---|---|
| Dangelo T T | -- | None Available | |
| Dangelo T T | -- | None Available | |
| Dangelo T T | -- | None Available | |
| Dangelo Michael J | $487,500 | -- | |
| Dangelo Michael J | $487,500 | -- | |
| Rizzo Jessica D | -- | -- | |
| Rizzo Jessica D | -- | -- | |
| Rizzo Michael P | $465,000 | -- | |
| Rizzo Michael P | $465,000 | -- |
Source: Public Records
Mortgage History
| Date | Status | Borrower | Loan Amount |
|---|---|---|---|
| Previous Owner | Rizzo Michael P | $250,000 | |
| Previous Owner | Rizzo Michael P | $100,000 | |
| Closed | Rizzo Michael P | $0 |
Source: Public Records
Tax History Compared to Growth
Tax History
| Year | Tax Paid | Tax Assessment Tax Assessment Total Assessment is a certain percentage of the fair market value that is determined by local assessors to be the total taxable value of land and additions on the property. | Land | Improvement |
|---|---|---|---|---|
| 2025 | $9,249 | $321,810 | $0 | $321,810 |
| 2024 | $8,679 | $321,810 | $0 | $321,810 |
| 2023 | $8,444 | $321,810 | $0 | $321,810 |
| 2022 | $8,305 | $239,530 | $0 | $239,530 |
| 2021 | $8,300 | $239,530 | $0 | $239,530 |
| 2020 | $8,326 | $239,530 | $0 | $239,530 |
| 2019 | $8,328 | $239,530 | $0 | $239,530 |
| 2018 | $8,202 | $239,530 | $0 | $239,530 |
| 2017 | $9,631 | $284,340 | $0 | $284,340 |
| 2016 | $9,554 | $284,340 | $0 | $284,340 |
| 2015 | $9,403 | $284,340 | $0 | $284,340 |
| 2014 | $9,471 | $284,340 | $0 | $284,340 |
Source: Public Records
Map
Nearby Homes
- 183 Mount Pleasant Rd
- 603 Brookside Ct Unit 603
- 433 Brookside Ct Unit 433
- 149 Mount Pleasant Rd
- 6 Violette Rd
- 199 Walnut Hill Rd
- 32 Redwood Dr
- 521 Copper Square Dr
- 7 Mcneil Rd
- 123 Old Hawleyville Rd
- 21 Adams Dr
- 23 Taunton Ln
- 12 Fieldstone Ct Unit 12
- 8 Fieldstone Ct Unit 8
- 10 Fieldstone Ct Unit 10
- 6 Fieldstone Ct
- 16 Farrell Rd
- 23 Farrell Rd
- 18 Sand Hill Rd
- 14 Sand Hill Rd
- 30 Franklin Ct
- 32 Franklin Ct Unit 32
- 30 Franklin Ct Unit 30
- 29 Franklin Ct
- 28 Franklin Ct
- 28 Franklin Ct Unit 28
- 27 Franklin Ct
- 27 Franklin Ct Unit 27
- 8 Franklin Ct
- 8 Franklin Ct Unit 8
- 31 Franklin Ct
- 31 Franklin Ct Unit 31
- 7 Franklin Ct
- 25 Franklin Ct
- 26 Franklin Ct
- 3 Franklin Ct
- 5 Franklin Ct
- 13 Franklin Ct
- 13 Franklin Ct Unit 13
- 4 Franklin Ct