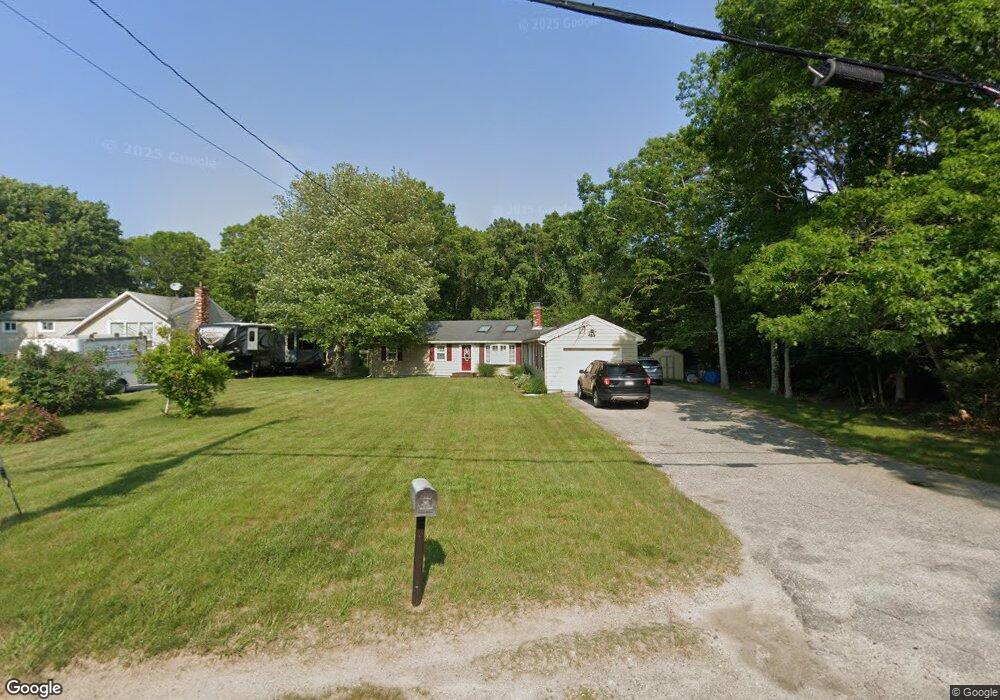
32 Fresh Pond Cir Unit HOUSE Plymouth, MA 02360
Estimated Value: $627,000 - $725,488
5
Beds
1
Bath
1,972
Sq Ft
$338/Sq Ft
Est. Value
About This Home
This home is located at 32 Fresh Pond Cir Unit HOUSE, Plymouth, MA 02360 and is currently estimated at $666,372, approximately $337 per square foot. 32 Fresh Pond Cir Unit HOUSE is a home located in Plymouth County with nearby schools including Manomet Elementary School, Plymouth Community Intermediate, and Plymouth North High School.
Ownership History
Date
Name
Owned For
Owner Type
Purchase Details
Closed on
Feb 21, 2014
Sold by
Castle Property Llc
Bought by
Zachary Todd J and Zachary Elane F
Current Estimated Value
Home Financials for this Owner
Home Financials are based on the most recent Mortgage that was taken out on this home.
Original Mortgage
$287,375
Outstanding Balance
$218,502
Interest Rate
4.5%
Mortgage Type
New Conventional
Estimated Equity
$447,870
Purchase Details
Closed on
Oct 25, 2013
Sold by
Mccarthy Christopher and Mccarthy Gretchen
Bought by
Castle Property Llc
Home Financials for this Owner
Home Financials are based on the most recent Mortgage that was taken out on this home.
Original Mortgage
$170,000
Interest Rate
4.56%
Mortgage Type
New Conventional
Purchase Details
Closed on
Oct 28, 2004
Sold by
Sliney Fred
Bought by
Mccarthy Chris and Chadwick Gretchen
Purchase Details
Closed on
Mar 10, 2003
Sold by
Sliney Fred and Sliney Francine
Bought by
Sliney Fred
Purchase Details
Closed on
Feb 11, 2000
Sold by
Donahue Eileen F
Bought by
Sliney Fred and Sliney Francine
Create a Home Valuation Report for This Property
The Home Valuation Report is an in-depth analysis detailing your home's value as well as a comparison with similar homes in the area
Home Values in the Area
Average Home Value in this Area
Purchase History
| Date | Buyer | Sale Price | Title Company |
|---|---|---|---|
| Zachary Todd J | $302,500 | -- | |
| Castle Property Llc | $155,000 | -- | |
| Mccarthy Chris | $298,000 | -- | |
| Sliney Fred | -- | -- | |
| Sliney Fred | $121,375 | -- |
Source: Public Records
Mortgage History
| Date | Status | Borrower | Loan Amount |
|---|---|---|---|
| Open | Zachary Todd J | $287,375 | |
| Previous Owner | Castle Property Llc | $170,000 | |
| Previous Owner | Castle Property Llc | $41,500 | |
| Previous Owner | Sliney Fred | $352,764 | |
| Previous Owner | Sliney Fred | $347,784 |
Source: Public Records
Tax History Compared to Growth
Tax History
| Year | Tax Paid | Tax Assessment Tax Assessment Total Assessment is a certain percentage of the fair market value that is determined by local assessors to be the total taxable value of land and additions on the property. | Land | Improvement |
|---|---|---|---|---|
| 2025 | $7,369 | $580,700 | $218,800 | $361,900 |
| 2024 | $6,933 | $538,700 | $199,200 | $339,500 |
| 2023 | $6,814 | $497,000 | $180,600 | $316,400 |
| 2022 | $6,419 | $416,000 | $170,300 | $245,700 |
| 2021 | $6,108 | $378,000 | $170,300 | $207,700 |
| 2020 | $5,883 | $359,800 | $154,800 | $205,000 |
| 2019 | $5,675 | $343,100 | $144,500 | $198,600 |
| 2018 | $5,435 | $330,200 | $134,200 | $196,000 |
| 2017 | $5,168 | $311,700 | $134,200 | $177,500 |
| 2016 | $4,917 | $302,200 | $123,800 | $178,400 |
| 2015 | $4,695 | $302,100 | $118,700 | $183,400 |
| 2014 | $3,519 | $232,600 | $118,700 | $113,900 |
Source: Public Records
Map
Nearby Homes
- 11 April Way
- 115 Andrews Way
- 39 Miter Dr Unit 8-1
- 82 Miter Dr Unit 2-1
- 88 Miter Dr Unit 1-1
- 90 Miter Dr Unit 1-3
- 91 Miter Dr Unit 18-1
- 91 Miter Dr Unit 16-1
- 91 Miter Dr Unit 18-2
- 91 Miter Dr Unit 16-3
- The Hickory Plan at Alden's Reach - Attached & Detached Single Family Homes
- The Pine Plan at Alden's Reach - Attached & Detached Single Family Homes
- The Oak Plan at Alden's Reach - Attached & Detached Single Family Homes
- The Spruce Plan at Alden's Reach - Attached & Detached Single Family Homes
- 91 Miter Dr Unit 3-2
- 91 Miter Dr Unit 25-2
- 24 Drum Dr Unit 24
- 9 Melix Ave
- 87 Miter Dr Unit 6-1
- 79 Miter Dr Unit 7-2
- 32 Fresh Pond Cir
- 30 Fresh Pond Cir
- 22 Carolyn Dr
- 9 Cottontail Trail
- 24 Carolyn Dr
- 31 Fresh Pond Cir
- 26 Carolyn Dr
- 16 Carolyn Dr
- 28 Fresh Pond Cir
- 29 Fresh Pond Cir
- 15 Cottontail Trail
- 28 Carolyn Dr
- 14 Carolyn Dr
- 10 Cottontail Trail
- 26 Fresh Pond Cir
- 21 Carolyn Dr
- 27 Fresh Pond Cir
- 14 Cottontail Trail
- 30 Carolyn Dr
- 12 Carolyn Dr