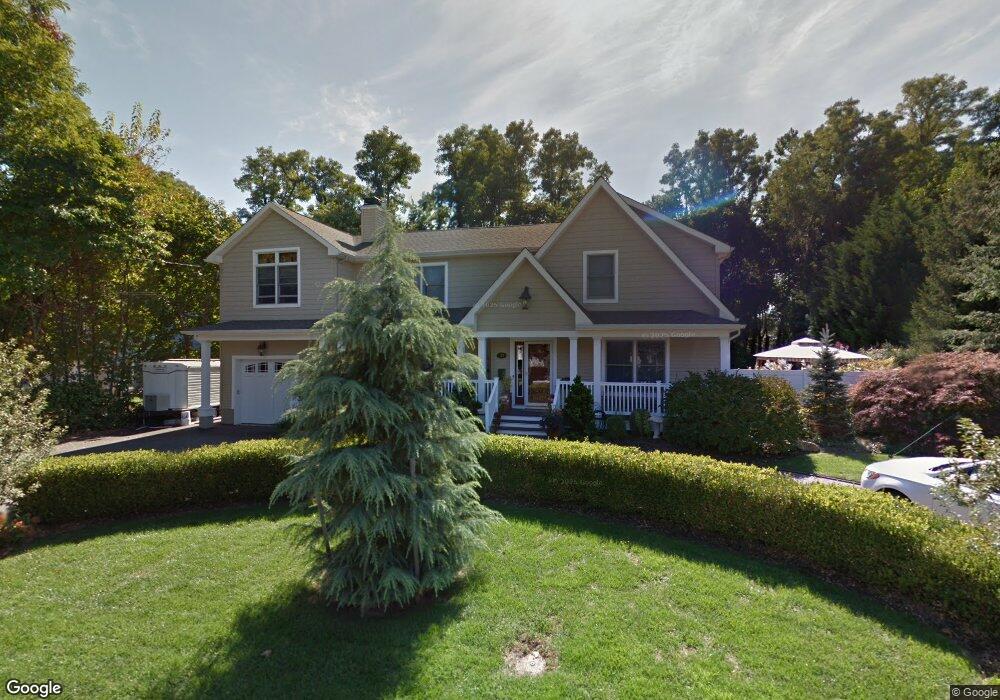
32 Fulton Ave West Long Branch, NJ 07764
Estimated Value: $1,554,000 - $1,918,000
4
Beds
3
Baths
3,598
Sq Ft
$475/Sq Ft
Est. Value
About This Home
This home is located at 32 Fulton Ave, West Long Branch, NJ 07764 and is currently estimated at $1,710,085, approximately $475 per square foot. 32 Fulton Ave is a home located in Monmouth County with nearby schools including Betty McElmon Elementary School, Frank Antonides School, and Shore Regional High School.
Ownership History
Date
Name
Owned For
Owner Type
Purchase Details
Closed on
Dec 14, 2017
Sold by
Hegarty John E
Bought by
Kraien Nathan and Kraien Adele
Current Estimated Value
Home Financials for this Owner
Home Financials are based on the most recent Mortgage that was taken out on this home.
Original Mortgage
$600,000
Outstanding Balance
$505,278
Interest Rate
3.95%
Mortgage Type
Adjustable Rate Mortgage/ARM
Estimated Equity
$1,204,807
Purchase Details
Closed on
Mar 29, 2011
Sold by
Hegarty John E
Bought by
Hegarty John E
Home Financials for this Owner
Home Financials are based on the most recent Mortgage that was taken out on this home.
Original Mortgage
$374,000
Interest Rate
4.82%
Mortgage Type
New Conventional
Purchase Details
Closed on
May 24, 1995
Sold by
Estate Of Margaret Yenesei
Bought by
Hegarty John and Hegarty Joette
Home Financials for this Owner
Home Financials are based on the most recent Mortgage that was taken out on this home.
Original Mortgage
$120,000
Interest Rate
8.2%
Create a Home Valuation Report for This Property
The Home Valuation Report is an in-depth analysis detailing your home's value as well as a comparison with similar homes in the area
Home Values in the Area
Average Home Value in this Area
Purchase History
| Date | Buyer | Sale Price | Title Company |
|---|---|---|---|
| Kraien Nathan | $785,000 | None Available | |
| Hegarty John E | -- | Allstates Title Service Inc | |
| Hegarty John | $150,500 | -- |
Source: Public Records
Mortgage History
| Date | Status | Borrower | Loan Amount |
|---|---|---|---|
| Open | Kraien Nathan | $600,000 | |
| Previous Owner | Hegarty John E | $374,000 | |
| Previous Owner | Hegarty John | $120,000 |
Source: Public Records
Tax History Compared to Growth
Tax History
| Year | Tax Paid | Tax Assessment Tax Assessment Total Assessment is a certain percentage of the fair market value that is determined by local assessors to be the total taxable value of land and additions on the property. | Land | Improvement |
|---|---|---|---|---|
| 2025 | $17,588 | $1,294,400 | $708,500 | $585,900 |
| 2024 | $17,658 | $1,349,800 | $727,700 | $622,100 |
| 2023 | $17,658 | $1,264,000 | $644,000 | $620,000 |
| 2022 | $16,548 | $1,119,100 | $528,800 | $590,300 |
| 2021 | $16,424 | $856,100 | $338,400 | $517,700 |
| 2020 | $16,424 | $799,200 | $293,200 | $506,000 |
| 2019 | $15,667 | $766,500 | $263,400 | $503,100 |
| 2018 | $14,966 | $707,300 | $228,000 | $479,300 |
| 2017 | $13,854 | $625,200 | $208,600 | $416,600 |
| 2016 | $13,666 | $629,200 | $223,000 | $406,200 |
| 2015 | $13,239 | $608,700 | $213,000 | $395,700 |
| 2014 | $13,410 | $575,300 | $198,000 | $377,300 |
Source: Public Records
Map
Nearby Homes