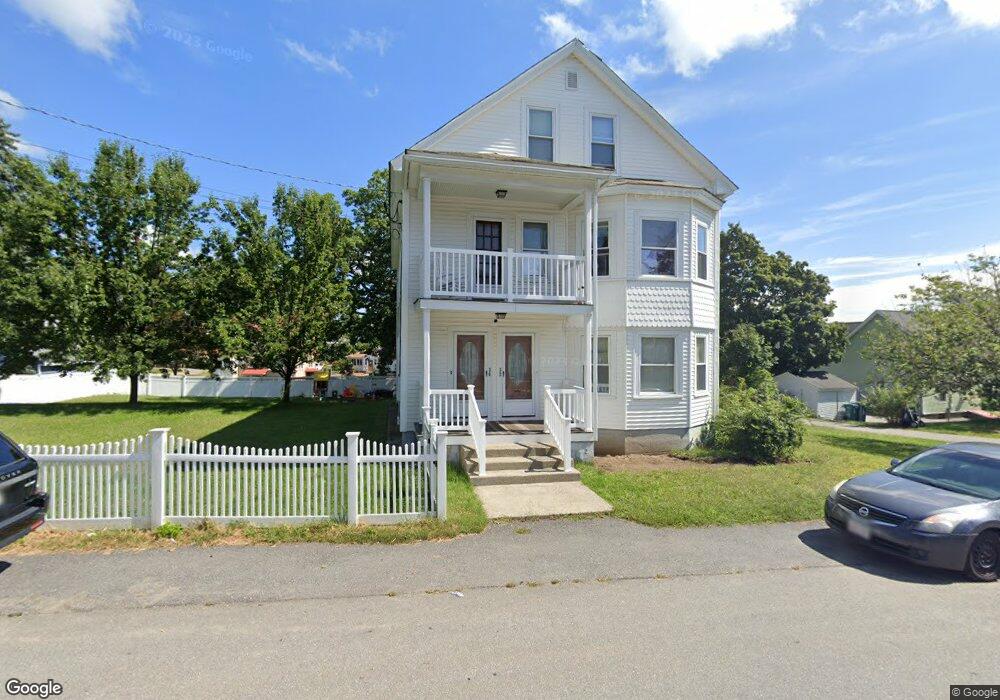
32 Fulton St Fitchburg, MA 01420
Estimated Value: $483,000 - $638,000
6
Beds
2
Baths
3,490
Sq Ft
$160/Sq Ft
Est. Value
About This Home
This home is located at 32 Fulton St, Fitchburg, MA 01420 and is currently estimated at $560,021, approximately $160 per square foot. 32 Fulton St is a home located in Worcester County with nearby schools including South Street Elementary School, Crocker Elementary School, and Reingold Elementary School.
Ownership History
Date
Name
Owned For
Owner Type
Purchase Details
Closed on
Apr 30, 2019
Sold by
Gagne Marcel B and Grady Yolanda J
Bought by
Reilly Daniel P
Current Estimated Value
Home Financials for this Owner
Home Financials are based on the most recent Mortgage that was taken out on this home.
Original Mortgage
$204,800
Outstanding Balance
$180,423
Interest Rate
4.3%
Mortgage Type
New Conventional
Estimated Equity
$379,598
Purchase Details
Closed on
May 11, 1976
Bought by
Gagne Marcel B and Gagne Yolanda J
Create a Home Valuation Report for This Property
The Home Valuation Report is an in-depth analysis detailing your home's value as well as a comparison with similar homes in the area
Home Values in the Area
Average Home Value in this Area
Purchase History
| Date | Buyer | Sale Price | Title Company |
|---|---|---|---|
| Reilly Daniel P | $256,000 | -- | |
| Gagne Marcel B | $33,500 | -- |
Source: Public Records
Mortgage History
| Date | Status | Borrower | Loan Amount |
|---|---|---|---|
| Open | Reilly Daniel P | $204,800 |
Source: Public Records
Tax History Compared to Growth
Tax History
| Year | Tax Paid | Tax Assessment Tax Assessment Total Assessment is a certain percentage of the fair market value that is determined by local assessors to be the total taxable value of land and additions on the property. | Land | Improvement |
|---|---|---|---|---|
| 2025 | $57 | $421,700 | $102,800 | $318,900 |
| 2024 | $5,406 | $365,000 | $70,700 | $294,300 |
| 2023 | $5,213 | $325,400 | $60,800 | $264,600 |
| 2022 | $4,540 | $257,800 | $50,900 | $206,900 |
| 2021 | $4,211 | $221,300 | $36,800 | $184,500 |
| 2020 | $3,952 | $200,500 | $33,900 | $166,600 |
| 2019 | $3,711 | $181,100 | $48,100 | $133,000 |
| 2018 | $3,494 | $166,300 | $45,200 | $121,100 |
| 2017 | $3,228 | $150,200 | $45,200 | $105,000 |
| 2016 | $3,100 | $146,000 | $41,000 | $105,000 |
| 2015 | $2,914 | $140,900 | $39,600 | $101,300 |
| 2014 | $2,794 | $140,900 | $39,600 | $101,300 |
Source: Public Records
Map
Nearby Homes