Estimated Value: $129,330 - $267,000
--
Bed
1
Bath
940
Sq Ft
$203/Sq Ft
Est. Value
About This Home
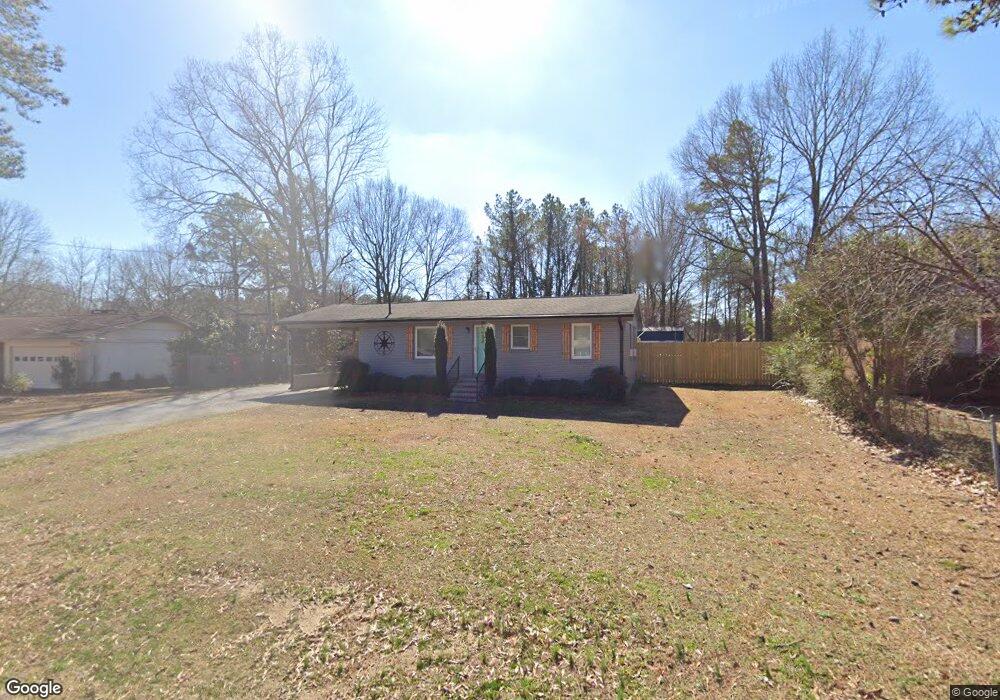
This home is located at 32 Glen View Dr NE, Rome, GA 30165 and is currently estimated at $190,833, approximately $203 per square foot. 32 Glen View Dr NE is a home located in Floyd County with nearby schools including Armuchee Middle School, Armuchee High School, and Unity Christian School.
Ownership History
Date
Name
Owned For
Owner Type
Purchase Details
Closed on
Jul 20, 2017
Sold by
Waters Sherry Holcombe
Bought by
Holcombe James Franklin
Current Estimated Value
Purchase Details
Closed on
Mar 21, 2013
Sold by
Holcombe Odessa
Bought by
Waters Sherry Holcombe and Waters Patricia
Purchase Details
Closed on
Sep 28, 2011
Sold by
Holcombe Waters Sherry and Holcom Patricia
Bought by
Holcombe Odessa Waters Sherry
Purchase Details
Closed on
Mar 25, 2005
Sold by
Holcombe James T and Holcombe Odessa Holcombe
Bought by
Holcombe Odessa
Purchase Details
Closed on
Dec 31, 2002
Sold by
Waters Sherry Holcombe and Patricia Holcom
Bought by
Holcombe James T and Odessa Holcombe
Purchase Details
Closed on
Oct 6, 1997
Sold by
Waters Sherry Holcombe
Bought by
Waters Sherry Holcombe and Waters Patricia H
Purchase Details
Closed on
Sep 27, 1996
Sold by
Holcome James T
Bought by
Waters Sherry Holcombe
Purchase Details
Closed on
Jan 1, 1956
Bought by
Holcome James T
Create a Home Valuation Report for This Property
The Home Valuation Report is an in-depth analysis detailing your home's value as well as a comparison with similar homes in the area
Home Values in the Area
Average Home Value in this Area
Purchase History
| Date | Buyer | Sale Price | Title Company |
|---|---|---|---|
| Holcombe James Franklin | -- | -- | |
| Waters Sherry Holcombe | -- | -- | |
| Holcombe Odessa Waters Sherry | -- | -- | |
| Holcombe Odessa | -- | -- | |
| Holcombe James T | -- | -- | |
| Waters Sherry Holcombe | -- | -- | |
| Waters Sherry Holcombe | -- | -- | |
| Holcome James T | -- | -- |
Source: Public Records
Tax History Compared to Growth
Tax History
| Year | Tax Paid | Tax Assessment Tax Assessment Total Assessment is a certain percentage of the fair market value that is determined by local assessors to be the total taxable value of land and additions on the property. | Land | Improvement |
|---|---|---|---|---|
| 2024 | $835 | $43,100 | $6,936 | $36,164 |
| 2023 | $818 | $40,715 | $6,120 | $34,595 |
| 2022 | $671 | $31,499 | $4,896 | $26,603 |
| 2021 | $583 | $26,120 | $4,896 | $21,224 |
| 2020 | $526 | $22,820 | $3,672 | $19,148 |
| 2019 | $499 | $21,584 | $3,672 | $17,912 |
| 2018 | $417 | $17,021 | $3,672 | $13,349 |
| 2017 | $495 | $16,424 | $3,672 | $12,752 |
| 2016 | $486 | $15,936 | $3,640 | $12,296 |
| 2015 | $122 | $15,936 | $3,640 | $12,296 |
| 2014 | $122 | $15,936 | $3,640 | $12,296 |
Source: Public Records
Map
Nearby Homes
- 4 Sleepy Oaks Trail NE
- The Pearson Plan at Southbend
- The Harrington Plan at Southbend
- The Landen Plan at Southbend
- The Benson II Plan at Southbend
- The Caldwell Plan at Southbend
- The Bradley Plan at Southbend
- The McGinnis Plan at Southbend
- The Crawford Plan at Southbend
- 109 Royal Oak Dr NE
- 100 Royal Oak Dr NE
- 10 Oak View Dr NE
- 24 Sleepy Oaks Trail NE
- 17 Royal Oak Dr NE
- 107 Selman Rd NW
- 3 Coggins Place NE
- 3 Coggins Place NE
- KERRY Plan at Northberry
- BELHAVEN Plan at Northberry
- CALI Plan at Northberry
- 30 Glen View Dr NE
- 34 Glen View Dr NE
- 28 Glen View Dr NE
- 36 Glen View Dr NE
- 31 Glen View Dr NE
- 29 Glen View Dr NE
- 33 Glen View Dr NE
- 27 Glen View Dr NE
- 26 Glen View Dr NE
- 68 Gene Dr NE
- 35 Glen View Dr NE
- 673 Old Dalton Rd NE Unit 1,2
- 673 Old Dalton Rd NE
- 37 Glen View Dr NE
- 25 Glen View Dr NE
- 657 Old Dalton Rd NE
- 24 Glen View Dr NE
- 190 Beard Dr NE
- 190 Beard Dr NE
- 190 Beard Dr NE