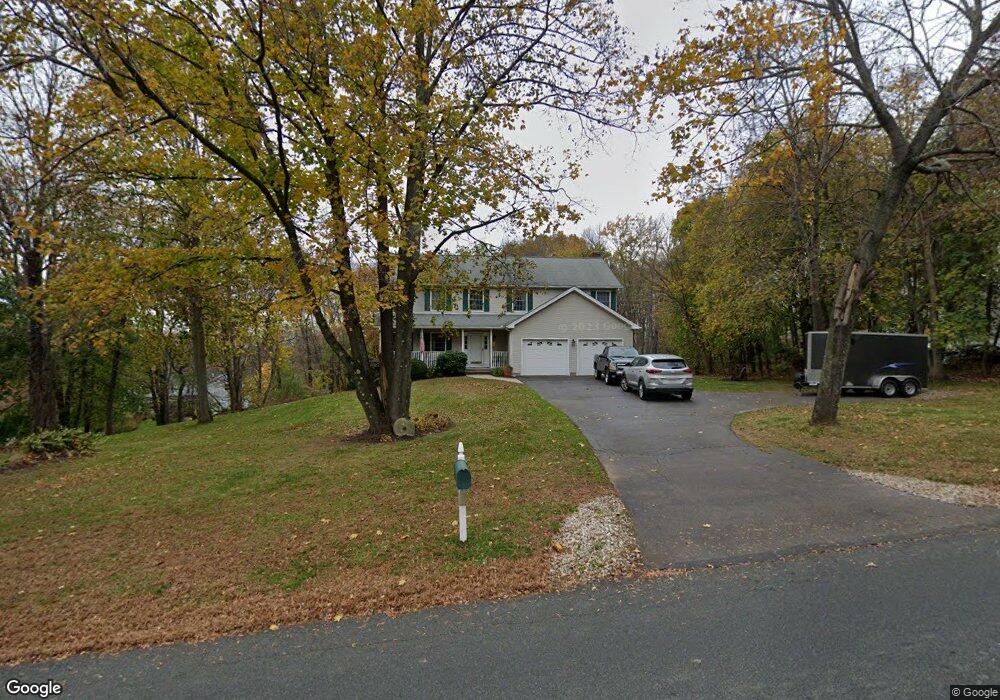
32 Griffin Rd Broad Brook, CT 06016
Estimated Value: $420,000 - $580,000
4
Beds
3
Baths
2,464
Sq Ft
$208/Sq Ft
Est. Value
About This Home
This home is located at 32 Griffin Rd, Broad Brook, CT 06016 and is currently estimated at $513,389, approximately $208 per square foot. 32 Griffin Rd is a home located in Hartford County with nearby schools including Broad Brook Elementary School, East Windsor Middle School, and East Windsor High School.
Ownership History
Date
Name
Owned For
Owner Type
Purchase Details
Closed on
Feb 27, 1998
Sold by
Giroux Mario and Giroux Joanne
Bought by
Litwin Sandra and Litwin Steven
Current Estimated Value
Home Financials for this Owner
Home Financials are based on the most recent Mortgage that was taken out on this home.
Original Mortgage
$152,800
Interest Rate
6.88%
Mortgage Type
Unknown
Purchase Details
Closed on
Mar 27, 1997
Sold by
Aldi David and Aldi Lori
Bought by
Giroux Mario and Giroux Joanne
Purchase Details
Closed on
Aug 28, 1996
Sold by
Creative Comm Rlty
Bought by
Aldi David and Aldi Lori
Home Financials for this Owner
Home Financials are based on the most recent Mortgage that was taken out on this home.
Original Mortgage
$185,400
Interest Rate
7.13%
Mortgage Type
Unknown
Create a Home Valuation Report for This Property
The Home Valuation Report is an in-depth analysis detailing your home's value as well as a comparison with similar homes in the area
Home Values in the Area
Average Home Value in this Area
Purchase History
| Date | Buyer | Sale Price | Title Company |
|---|---|---|---|
| Litwin Sandra | $191,000 | -- | |
| Giroux Mario | $47,800 | -- | |
| Aldi David | $46,075 | -- |
Source: Public Records
Mortgage History
| Date | Status | Borrower | Loan Amount |
|---|---|---|---|
| Open | Aldi David | $75,000 | |
| Closed | Aldi David | $152,800 | |
| Previous Owner | Aldi David | $185,400 |
Source: Public Records
Tax History
| Year | Tax Paid | Tax Assessment Tax Assessment Total Assessment is a certain percentage of the fair market value that is determined by local assessors to be the total taxable value of land and additions on the property. | Land | Improvement |
|---|---|---|---|---|
| 2025 | $7,966 | $300,730 | $75,020 | $225,710 |
| 2024 | $7,386 | $300,730 | $75,020 | $225,710 |
| 2023 | $5,518 | $160,960 | $49,690 | $111,270 |
| 2022 | $6,143 | $160,960 | $49,690 | $111,270 |
| 2021 | $5,553 | $160,960 | $49,690 | $111,270 |
| 2020 | $5,589 | $160,960 | $49,690 | $111,270 |
| 2019 | $5,513 | $160,960 | $49,690 | $111,270 |
| 2018 | $5,457 | $160,960 | $49,690 | $111,270 |
| 2017 | $5,020 | $153,190 | $50,690 | $102,500 |
| 2016 | $4,738 | $153,190 | $50,690 | $102,500 |
| 2015 | $4,643 | $153,190 | $50,690 | $102,500 |
| 2014 | $4,562 | $153,190 | $50,690 | $102,500 |
Source: Public Records
Map
Nearby Homes
- 76 Griffin Rd
- 72 Rockville Rd
- 610 Niederwerfer Rd
- 814 Graham Rd
- 64 Garnet Ln
- 0 Thrall Rd Unit 24150600
- 3 Brookmeadow Ln
- 555 Graham Rd
- 4 Jessie Ln
- 11 Settlers Way
- 74 Wapping Wood Rd
- 77 Thrall Rd
- 20 Apothecaries Hall Rd
- 0 Chamberlain Rd Unit 24154561
- 183 Chamberlain Rd
- 1 Abbott Rd Unit 153
- 1 Abbott Rd Unit 44
- 1 Abbott Rd Unit 40
- 33 Ash Rd
- 14 Pinney St Unit 46
- 33 Griffin Rd
- 30 Griffin Rd
- 62 Barber Hill Rd
- 34 Griffin Rd
- 36 Griffin Rd
- 29 Griffin Rd
- 24-4 Griffin Rd
- 68 Barber Hill Rd
- 60 Barber Hill Rd
- 22 Griffin Rd
- 2 Sunview Dr
- 4 Sunview Dr
- 6 Sunview Dr
- 57 Barber Hill Rd
- 58 Barber Hill Rd
- 65 Barber Hill Rd
- 18 Griffin Rd
- 8 Sunview Dr
- 74 Barber Hill Rd
- 56 Barber Hill Rd
Your Personal Tour Guide
Ask me questions while you tour the home.