N
Seller's Agent in 2017
Nancy Ergmann
CENTURY 21 Atlantic Realty
Estimated Value: $523,000 - $582,000
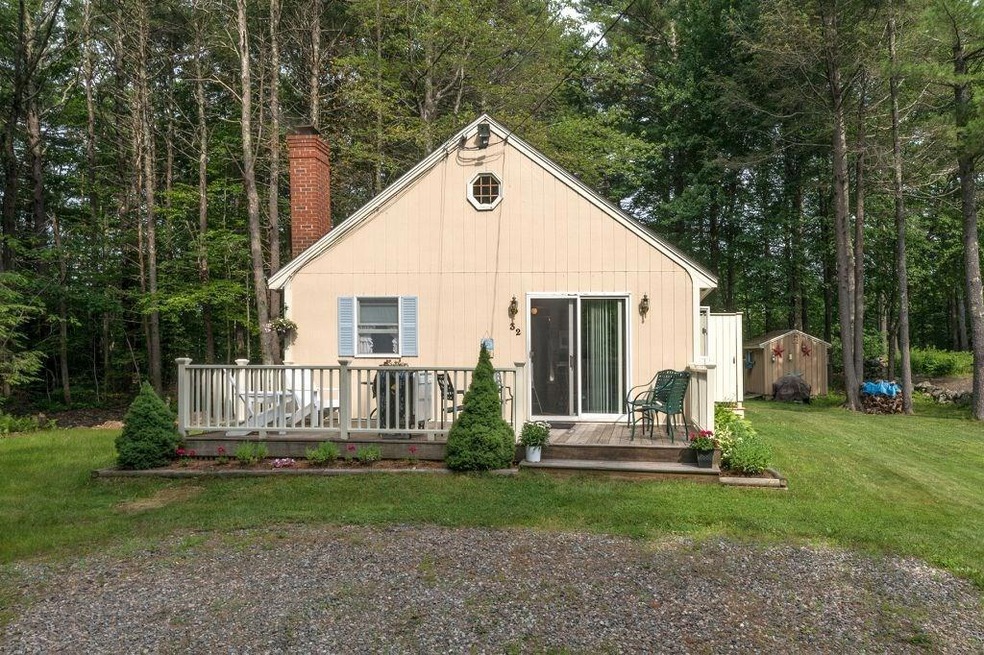
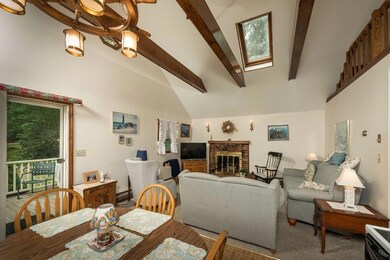
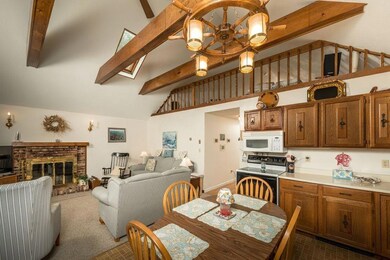
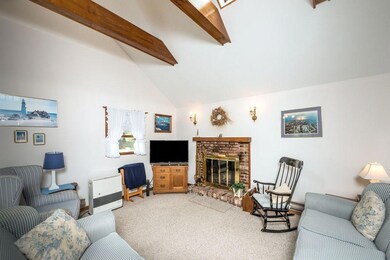
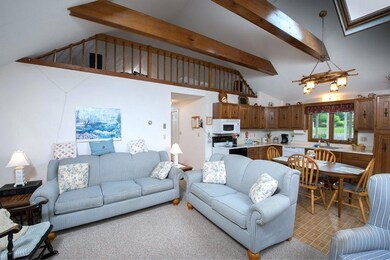
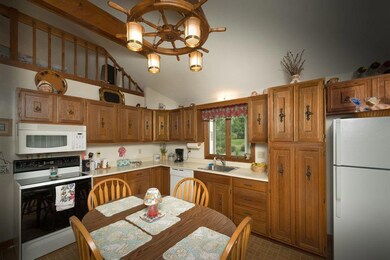
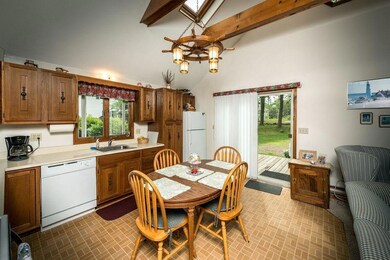
ENJOY YOUR TIME AT THE BEACH! This adorable three bedroom Cottage is situated on a half acre lot on a private road in York. The home has an open concept kitchen, living room with a wood burning fireplace. Enjoy all three seasons on the enclosed back porch. There is additional sleeping space in the second floor loft that makes a great getaway for the kids. There is plenty of privacy along with a short walk to the beach. This is a year-round home near York's beaches. Call this one home!
Last Agent to Sell the Property
Nancy Ergmann
CENTURY 21 Atlantic Realty Listed on: 07/03/2017
Last Buyer's Agent
Jean Kovacs
STONE & STONE Real Estate Services, Inc.
| Date | Buyer | Sale Price | Title Company |
|---|---|---|---|
| Chambless Glenn | $265,000 | -- | |
| Chambless Glenn | $265,000 | -- |
| Date | Status | Borrower | Loan Amount |
|---|---|---|---|
| Open | Chambless Glenn | $238,500 | |
| Closed | Chambless Glenn | $238,500 |
| Date | Event | Price | List to Sale | Price per Sq Ft |
|---|---|---|---|---|
| 11/01/2017 11/01/17 | Sold | $265,000 | -11.1% | $204 / Sq Ft |
| 09/22/2017 09/22/17 | Pending | -- | -- | -- |
| 06/29/2017 06/29/17 | For Sale | $298,000 | -- | $230 / Sq Ft |
| Year | Tax Paid | Tax Assessment Tax Assessment Total Assessment is a certain percentage of the fair market value that is determined by local assessors to be the total taxable value of land and additions on the property. | Land | Improvement |
|---|---|---|---|---|
| 2024 | $3,714 | $442,100 | $247,000 | $195,100 |
| 2023 | $3,427 | $405,600 | $210,500 | $195,100 |
| 2022 | $3,460 | $404,700 | $222,200 | $182,500 |
| 2021 | $2,940 | $295,500 | $142,200 | $153,300 |
| 2020 | $2,631 | $237,000 | $142,200 | $94,800 |
| 2019 | $2,570 | $230,500 | $139,300 | $91,200 |
| 2018 | $2,306 | $206,800 | $115,600 | $91,200 |
| 2017 | $2,710 | $247,500 | $115,600 | $131,900 |
| 2016 | $2,804 | $251,500 | $106,700 | $144,800 |
| 2015 | $2,619 | $238,100 | $106,700 | $131,400 |
| 2014 | $2,548 | $238,100 | $106,700 | $131,400 |
| 2013 | $2,483 | $238,100 | $106,700 | $131,400 |
N
Seller's Agent in 2017
Nancy Ergmann
CENTURY 21 Atlantic Realty
J
Buyer's Agent in 2017
Jean Kovacs
STONE & STONE Real Estate Services, Inc.
E
Buyer's Agent in 2017
Eugenia Kovacs
RE/MAX
Source: Maine Listings
MLS Number: 1315558
APN: YORK-000032A-000000-000021
Disclaimer: Certain information contained herein is derived from information provided by parties other than Homes.com. All information provided is deemed reliable, but is not guaranteed to be accurate and should be independently verified.
![]() Listing data is derived in whole or in part from Maine Real Estate Information System, Inc. (d/b/a Maine Listings) and is for consumers' personal, noncommercial use only. Dimensions are approximate and not guaranteed. All data should be independently verified.
Listing data is derived in whole or in part from Maine Real Estate Information System, Inc. (d/b/a Maine Listings) and is for consumers' personal, noncommercial use only. Dimensions are approximate and not guaranteed. All data should be independently verified.
© 2026 Maine Real Estate Information System, Inc. All Rights Reserved. Equal Housing Opportunity.
Homes.com, LLC, 17600 Laguna Canyon Rd Irvine, CA 92618 (888)-952-6393
![]()
Ask me questions while you tour the home.