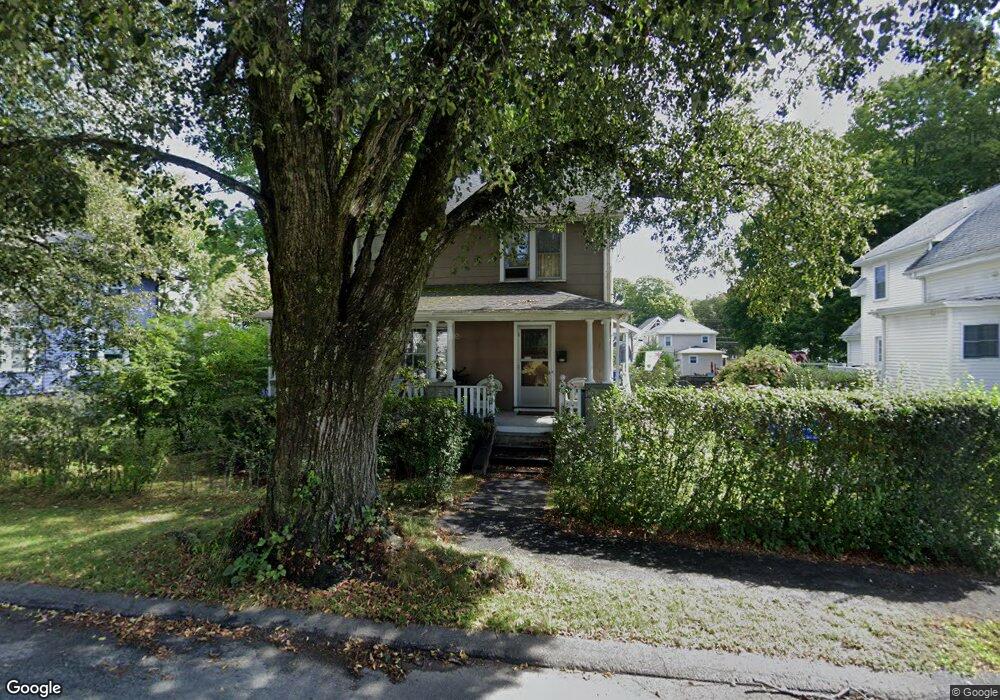
32 High St Natick, MA 01760
Estimated Value: $702,000 - $853,000
3
Beds
3
Baths
1,482
Sq Ft
$528/Sq Ft
Est. Value
About This Home
This home is located at 32 High St, Natick, MA 01760 and is currently estimated at $782,803, approximately $528 per square foot. 32 High St is a home located in Middlesex County with nearby schools including Natick High School, Johnson Elementary School, and J F Kennedy Middle School.
Ownership History
Date
Name
Owned For
Owner Type
Purchase Details
Closed on
Apr 25, 1997
Sold by
Hale Elizabeth C Est
Bought by
Mcdermott Tracy A and Mcquillen Charles S
Current Estimated Value
Home Financials for this Owner
Home Financials are based on the most recent Mortgage that was taken out on this home.
Original Mortgage
$149,600
Interest Rate
7.77%
Mortgage Type
Purchase Money Mortgage
Create a Home Valuation Report for This Property
The Home Valuation Report is an in-depth analysis detailing your home's value as well as a comparison with similar homes in the area
Home Values in the Area
Average Home Value in this Area
Purchase History
| Date | Buyer | Sale Price | Title Company |
|---|---|---|---|
| Mcdermott Tracy A | $187,000 | -- |
Source: Public Records
Mortgage History
| Date | Status | Borrower | Loan Amount |
|---|---|---|---|
| Open | Mcdermott Tracy A | $148,000 | |
| Closed | Mcdermott Tracy A | $149,600 |
Source: Public Records
Tax History
| Year | Tax Paid | Tax Assessment Tax Assessment Total Assessment is a certain percentage of the fair market value that is determined by local assessors to be the total taxable value of land and additions on the property. | Land | Improvement |
|---|---|---|---|---|
| 2025 | $7,886 | $659,400 | $407,200 | $252,200 |
| 2024 | $7,606 | $620,400 | $384,600 | $235,800 |
| 2023 | $7,358 | $582,100 | $362,000 | $220,100 |
| 2022 | $7,085 | $531,100 | $330,300 | $200,800 |
| 2021 | $4,349 | $500,500 | $312,200 | $188,300 |
| 2020 | $4,113 | $473,400 | $285,100 | $188,300 |
| 2019 | $4,330 | $473,400 | $285,100 | $188,300 |
| 2018 | $5,874 | $450,100 | $271,500 | $178,600 |
| 2017 | $5,287 | $391,900 | $239,800 | $152,100 |
| 2016 | $5,104 | $376,100 | $225,300 | $150,800 |
| 2015 | $5,028 | $363,800 | $225,300 | $138,500 |
Source: Public Records
Map
Nearby Homes
- 6 Floral Avenue Extension
- 8 Floral Avenue Extension
- 25 Forest Ave
- 63 Pond St
- 12 Floral Ave
- 58 W Central St
- 8 Floral Ave Unit 8
- 89 W Central St
- 16 West St
- 49 Summer St
- 14 Pinewood Ave
- 62 Oakland St
- 216-218 S Main St
- 9 Bellevue Rd
- 6A Lincoln St Unit 6A
- 11 Avon St
- 4B Lincoln St Unit 4B
- 5 Wilson St Unit 5A
- 3A Wilson St Unit 3A
- 3 Wilson St Unit 3B
Your Personal Tour Guide
Ask me questions while you tour the home.