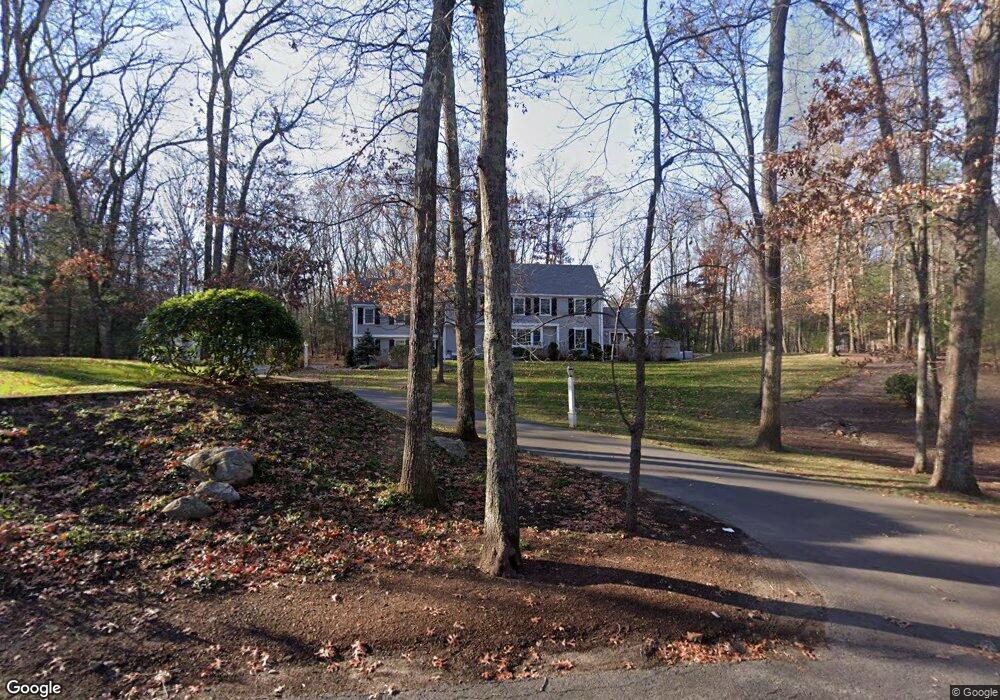
32 Highland Cir Wayland, MA 01778
Estimated Value: $1,741,180 - $1,966,000
5
Beds
3
Baths
4,189
Sq Ft
$443/Sq Ft
Est. Value
About This Home
This home is located at 32 Highland Cir, Wayland, MA 01778 and is currently estimated at $1,854,795, approximately $442 per square foot. 32 Highland Cir is a home located in Middlesex County with nearby schools including Wayland High School.
Ownership History
Date
Name
Owned For
Owner Type
Purchase Details
Closed on
Jul 31, 2020
Sold by
Smith Andrew and Pina-Smith Beatriz
Bought by
Andrew Mark Smith Ret
Current Estimated Value
Purchase Details
Closed on
Nov 30, 2005
Sold by
Mclallen Kathleen E and Mclallen Scott W
Bought by
Smith Andrew and Smith Beatriz Pina
Home Financials for this Owner
Home Financials are based on the most recent Mortgage that was taken out on this home.
Original Mortgage
$590,000
Interest Rate
6.14%
Mortgage Type
Purchase Money Mortgage
Purchase Details
Closed on
Sep 7, 2001
Sold by
Shine James P and Shine Barbara
Bought by
Mclallen Scott W and Mclallen Kathleen E
Home Financials for this Owner
Home Financials are based on the most recent Mortgage that was taken out on this home.
Original Mortgage
$638,500
Interest Rate
7.05%
Mortgage Type
Purchase Money Mortgage
Create a Home Valuation Report for This Property
The Home Valuation Report is an in-depth analysis detailing your home's value as well as a comparison with similar homes in the area
Home Values in the Area
Average Home Value in this Area
Purchase History
| Date | Buyer | Sale Price | Title Company |
|---|---|---|---|
| Andrew Mark Smith Ret | -- | None Available | |
| Smith Andrew | $1,175,000 | -- | |
| Mclallen Scott W | $1,015,000 | -- |
Source: Public Records
Mortgage History
| Date | Status | Borrower | Loan Amount |
|---|---|---|---|
| Previous Owner | Smith Andrew | $590,000 | |
| Previous Owner | Mclallen Scott W | $638,500 |
Source: Public Records
Tax History Compared to Growth
Tax History
| Year | Tax Paid | Tax Assessment Tax Assessment Total Assessment is a certain percentage of the fair market value that is determined by local assessors to be the total taxable value of land and additions on the property. | Land | Improvement |
|---|---|---|---|---|
| 2025 | $23,890 | $1,528,500 | $692,300 | $836,200 |
| 2024 | $22,636 | $1,458,500 | $659,200 | $799,300 |
| 2023 | $21,237 | $1,275,500 | $599,100 | $676,400 |
| 2022 | $20,928 | $1,140,500 | $509,200 | $631,300 |
| 2021 | $10,148 | $1,102,400 | $471,100 | $631,300 |
| 2020 | $19,673 | $1,107,700 | $471,100 | $636,600 |
| 2019 | $18,821 | $1,029,600 | $448,700 | $580,900 |
| 2018 | $18,300 | $1,015,000 | $467,400 | $547,600 |
| 2017 | $17,701 | $975,800 | $444,800 | $531,000 |
| 2016 | $16,707 | $963,500 | $453,200 | $510,300 |
| 2015 | $16,520 | $898,300 | $453,200 | $445,100 |
Source: Public Records
Map
Nearby Homes
- 50 3 Ponds Rd
- 448 & 454 Concord Rd
- 15 Lewis Path
- 24 Claypit Hill Rd
- 14 Lundy Ln
- 156 Cherry Brook Rd
- 31 White Rd
- 93 Old Sudbury Rd
- 10 Hayward Rd
- 19 Warren Ln
- 156 Boston Post Rd
- 236 Lincoln Rd
- 1 Aberdeen Rd
- 11 Wadsworth Ln Unit 11
- 19 Old Connecticut Path
- 52 Jericho Rd Unit 52
- 24 Jericho Rd Unit 24
- 17 Glezen Ln
- 2 Fox Chase Ln
- 8 Jericho Rd Unit 8
- 28 Highland Cir
- 36 Highland Cir
- 78 Highland Cir
- 33 Highland Cir
- 29 Highland Cir
- 88 Highland Cir
- 74 Highland Cir
- 3 Jericho Ln
- 42 Highland Cir
- 25 Highland Cir
- 22 Highland Cir
- 16 Highland Cir
- 9 Jericho Ln
- 81 Highland Cir
- 77 Highland Cir
- 70 Highland Cir
- 85 Highland Cir
- 43 Highland Cir
- 21 Highland Cir
- 48 Highland Cir