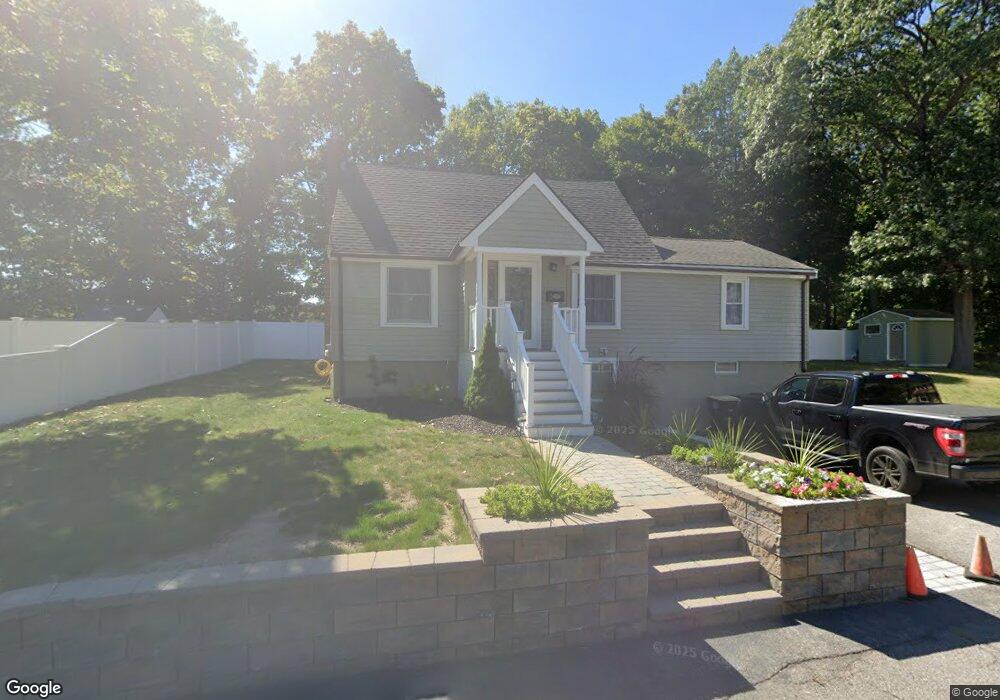
32 Holmberg Rd East Weymouth, MA 02189
East Weymouth NeighborhoodEstimated Value: $577,000 - $629,548
3
Beds
2
Baths
1,532
Sq Ft
$389/Sq Ft
Est. Value
About This Home
This home is located at 32 Holmberg Rd, East Weymouth, MA 02189 and is currently estimated at $595,887, approximately $388 per square foot. 32 Holmberg Rd is a home located in Norfolk County with nearby schools including Abigail Adams Middle School, William Seach Elementary School, and Weymouth Middle School Chapman.
Ownership History
Date
Name
Owned For
Owner Type
Purchase Details
Closed on
Jun 17, 2005
Sold by
White Christopher A and White Laurie
Bought by
Drummond George V and Drummond Ivani N
Current Estimated Value
Home Financials for this Owner
Home Financials are based on the most recent Mortgage that was taken out on this home.
Original Mortgage
$248,000
Outstanding Balance
$129,638
Interest Rate
5.78%
Mortgage Type
Purchase Money Mortgage
Estimated Equity
$466,250
Purchase Details
Closed on
Dec 13, 1991
Sold by
Smith Brian L and Smith June A
Bought by
White Chris A and White Laurie
Home Financials for this Owner
Home Financials are based on the most recent Mortgage that was taken out on this home.
Original Mortgage
$129,250
Interest Rate
8.73%
Mortgage Type
Purchase Money Mortgage
Create a Home Valuation Report for This Property
The Home Valuation Report is an in-depth analysis detailing your home's value as well as a comparison with similar homes in the area
Home Values in the Area
Average Home Value in this Area
Purchase History
| Date | Buyer | Sale Price | Title Company |
|---|---|---|---|
| Drummond George V | $310,000 | -- | |
| White Chris A | $127,675 | -- |
Source: Public Records
Mortgage History
| Date | Status | Borrower | Loan Amount |
|---|---|---|---|
| Open | Drummond George V | $248,000 | |
| Previous Owner | White Chris A | $180,000 | |
| Previous Owner | White Chris A | $129,250 |
Source: Public Records
Tax History Compared to Growth
Tax History
| Year | Tax Paid | Tax Assessment Tax Assessment Total Assessment is a certain percentage of the fair market value that is determined by local assessors to be the total taxable value of land and additions on the property. | Land | Improvement |
|---|---|---|---|---|
| 2025 | $5,719 | $566,200 | $219,600 | $346,600 |
| 2024 | $5,540 | $539,400 | $209,200 | $330,200 |
| 2023 | $5,222 | $499,700 | $193,700 | $306,000 |
| 2022 | $5,084 | $443,600 | $179,400 | $264,200 |
| 2021 | $4,785 | $407,600 | $179,400 | $228,200 |
| 2020 | $4,582 | $384,400 | $179,400 | $205,000 |
| 2019 | $4,506 | $371,800 | $172,500 | $199,300 |
| 2018 | $4,433 | $354,600 | $164,200 | $190,400 |
| 2017 | $3,889 | $303,600 | $156,400 | $147,200 |
| 2016 | $3,798 | $296,700 | $150,400 | $146,300 |
| 2015 | $3,571 | $276,800 | $143,600 | $133,200 |
| 2014 | $3,358 | $252,500 | $133,600 | $118,900 |
Source: Public Records
Map
Nearby Homes
- 303 Middle St
- 575 Broad St Unit 305
- 575 Broad St Unit 215
- 209 Lake St Unit 69
- 42 Sundin Rd
- 286 Essex St
- 449 Middle St
- 367 Essex St
- 12 Klasson Ln
- 56 Putnam St
- 145 Jaffrey St
- 286 Broad St
- 211 Lake Shore Dr
- 20 Richards Rd
- 669 Commercial St
- 1297 Pleasant St
- 17 Grove St
- 425 East St
- 38 School St Unit 2
- 19 Vine St Unit 3
- 35 Holmberg Rd
- 26 Holmberg Rd
- 31 Holmberg Rd
- 25 Holmberg Rd
- 20 Holmberg Rd
- 19 Holmberg Rd
- 13 Holmberg Rd
- 12 Holmberg Rd Unit 4
- 12 Holmberg Rd Unit 3
- 12 Holmberg Rd Unit 2
- 12 Holmberg Rd
- 275 Middle St
- 281 Middle St
- 267 Middle St
- 287 Middle St
- 307 Middle St
- 269 Middle St
- 297 Middle St
- 263 Middle St
- 276 Middle St