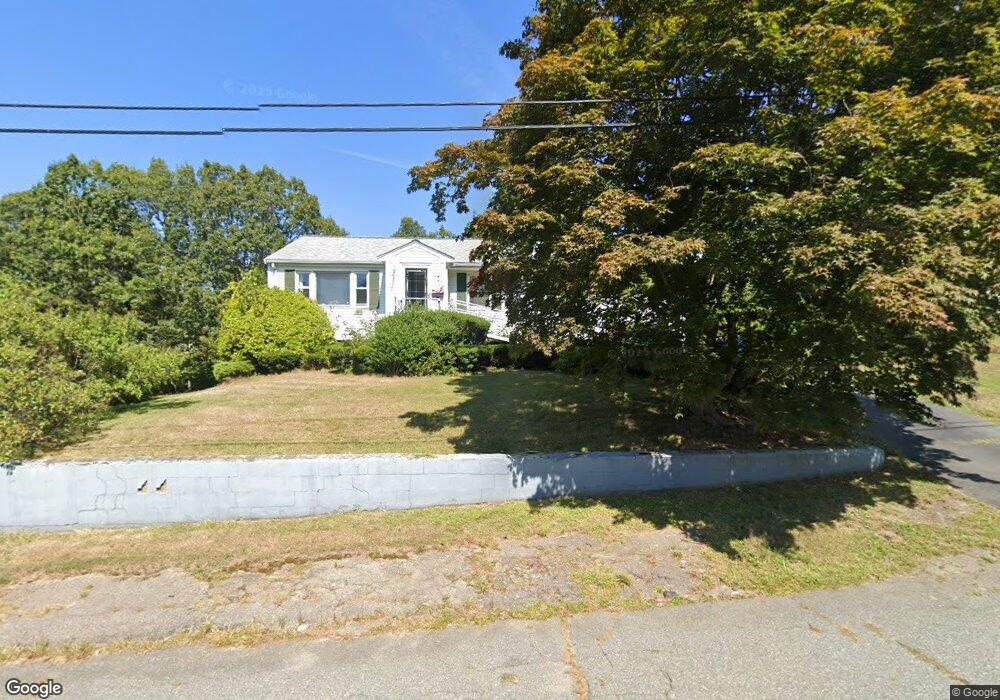
32 Isabel Cir Randolph, MA 02368
North Randolph NeighborhoodEstimated Value: $587,000 - $630,756
3
Beds
3
Baths
1,980
Sq Ft
$308/Sq Ft
Est. Value
About This Home
This home is located at 32 Isabel Cir, Randolph, MA 02368 and is currently estimated at $609,189, approximately $307 per square foot. 32 Isabel Cir is a home located in Norfolk County with nearby schools including Randolph High School and Thayer Academy.
Ownership History
Date
Name
Owned For
Owner Type
Purchase Details
Closed on
Nov 14, 2017
Sold by
Ridge Gerald and Ridge Patricia M
Bought by
Ridge Irt
Current Estimated Value
Purchase Details
Closed on
Oct 26, 2007
Sold by
Ridge Ft
Bought by
Ridge Gerald and Ridge Patricia M
Purchase Details
Closed on
Sep 26, 2001
Sold by
Fogelnest Rosalind S
Bought by
Ridge Patricia M and Ridge Gerald
Create a Home Valuation Report for This Property
The Home Valuation Report is an in-depth analysis detailing your home's value as well as a comparison with similar homes in the area
Home Values in the Area
Average Home Value in this Area
Purchase History
| Date | Buyer | Sale Price | Title Company |
|---|---|---|---|
| Ridge Irt | -- | -- | |
| Ridge Gerald | -- | -- | |
| Ridge Patricia M | $240,000 | -- |
Source: Public Records
Tax History
| Year | Tax Paid | Tax Assessment Tax Assessment Total Assessment is a certain percentage of the fair market value that is determined by local assessors to be the total taxable value of land and additions on the property. | Land | Improvement |
|---|---|---|---|---|
| 2025 | $6,063 | $522,200 | $230,600 | $291,600 |
| 2024 | $5,632 | $491,900 | $226,100 | $265,800 |
| 2023 | $5,457 | $451,700 | $205,500 | $246,200 |
| 2022 | $5,481 | $403,000 | $171,300 | $231,700 |
| 2021 | $5,483 | $371,000 | $142,800 | $228,200 |
| 2020 | $5,320 | $356,800 | $142,800 | $214,000 |
| 2019 | $5,108 | $341,000 | $136,000 | $205,000 |
| 2018 | $4,996 | $314,600 | $123,600 | $191,000 |
| 2017 | $4,660 | $288,000 | $117,600 | $170,400 |
| 2016 | $4,542 | $261,200 | $107,000 | $154,200 |
| 2015 | $4,411 | $243,700 | $101,900 | $141,800 |
Source: Public Records
Map
Nearby Homes
- 4 Powdrell Ave
- 107 Meadow Ln Unit 107
- 700 North St
- 12 Brewster Rd
- 661 North St
- 80 Lake St
- 6 Lunar Ave
- 469 North St
- 34 Orchard St
- 29 Saint Michael Rd
- 875 N Main St
- 9 Royal Crest Dr Unit 12
- 1 Royal Crest Dr Unit 12
- 591 N Main St
- 1579 Washington St
- 18 Royal Lake Dr Unit 3
- 20 Simmonds Blvd Unit 20
- 18 Simmonds Blvd Unit 18
- 8 Simmonds Blvd Unit 8
- 22 Simmonds Blvd Unit 22
Your Personal Tour Guide
Ask me questions while you tour the home.