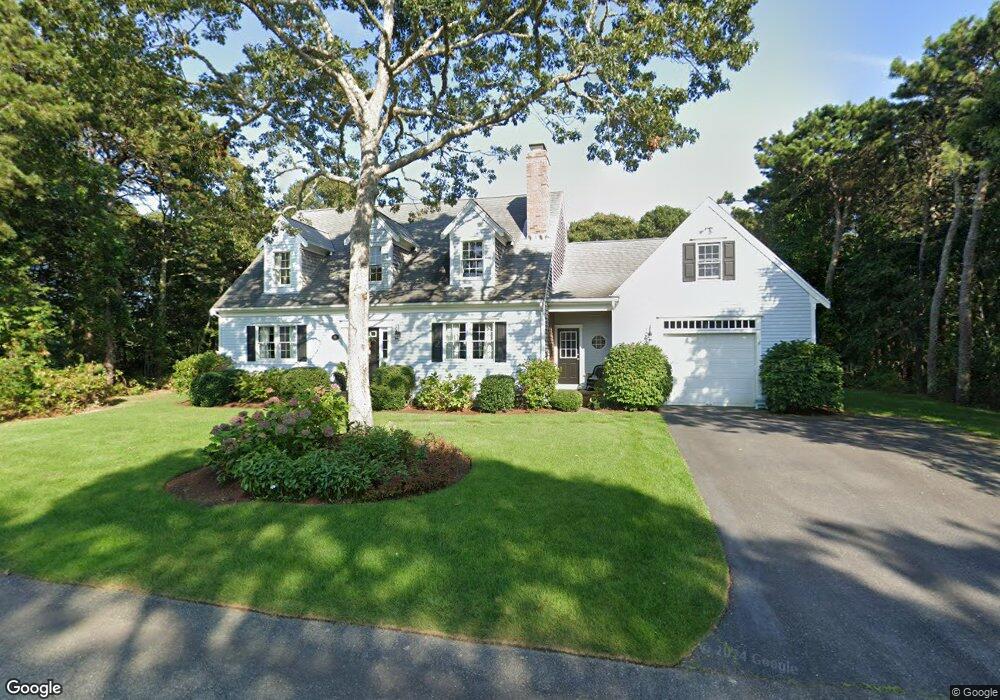
32 John St Chatham, MA 02633
West Chatham NeighborhoodEstimated Value: $1,583,000 - $1,762,744
About This Home
This home is located at 32 John St, Chatham, MA 02633 and is currently estimated at $1,656,936, approximately $697 per square foot. 32 John St is a home located in Barnstable County with nearby schools including Chatham Elementary School, Harwich Elementary School, and Monomoy Regional Middle School.
Ownership History
We collect this data history from publicly available records. To have your information removed, we recommend requesting removal directly through your county’s website.
Purchase Details
Home Values in the Area
Average Home Value in this Area
Purchase History
We collect this data history from publicly available records. To have your information removed, we recommend requesting removal directly through your county’s website.
| Date | Buyer | Sale Price | Title Company |
|---|---|---|---|
| $122,000 | -- |
Mortgage History
We collect this data history from publicly available records. To have your information removed, we recommend requesting removal directly through your county’s website.
| Date | Status | Borrower | Loan Amount |
|---|---|---|---|
| Closed | $295,000 | ||
| Closed | $375,000 | ||
| Closed | $371,000 | ||
| Closed | $374,000 | ||
| Closed | $375,000 | ||
| Closed | $360,000 | ||
| Closed | $400,000 | ||
| Closed | $95,000 |
Tax History
We collect this data history from publicly available records. To have your information removed, we recommend requesting removal directly through your county’s website.
| Year | Tax Paid | Tax Assessment Tax Assessment Total Assessment is a certain percentage of the fair market value that is determined by local assessors to be the total taxable value of land and additions on the property. | Land | Improvement |
|---|---|---|---|---|
| 2025 | $5,000 | $1,440,800 | $510,600 | $930,200 |
| 2024 | $4,891 | $1,370,100 | $481,700 | $888,400 |
| 2023 | $4,730 | $1,219,200 | $401,400 | $817,800 |
| 2022 | $4,162 | $900,800 | $401,400 | $499,400 |
| 2021 | $3,993 | $801,900 | $342,100 | $459,800 |
| 2020 | $3,776 | $783,300 | $319,000 | $464,300 |
| 2019 | $3,828 | $789,200 | $319,500 | $469,700 |
| 2018 | $3,657 | $751,000 | $319,500 | $431,500 |
| 2017 | $3,693 | $734,100 | $310,100 | $424,000 |
| 2016 | $3,637 | $724,600 | $304,100 | $420,500 |
| 2015 | $3,535 | $708,500 | $295,500 | $413,000 |
| 2014 | $3,591 | $706,900 | $295,500 | $411,400 |
Map
- 149 Island View Ln
- 35 Oak Ridge Cir
- 35 Oak Ridge Cir
- 70 Uncle Deane's Rd
- 19 Joshuas Way
- 50 Sylvan Way
- 44 Baileys Path
- 48 Sylvan Way
- 1761 Main St
- 1772 Main St
- 7 Aunt Matties Rd
- 38 Indian Trail
- 78 Indian Trail
- 92 Indian Trail
- 30 Indian Trail
- 18 Quail Trail
- 96 Stage Coach Dr
- 58 Tirrells Way
- 44 Buena Vista Rd
- 0 Tirrells Way
Ask me questions while you tour the home.