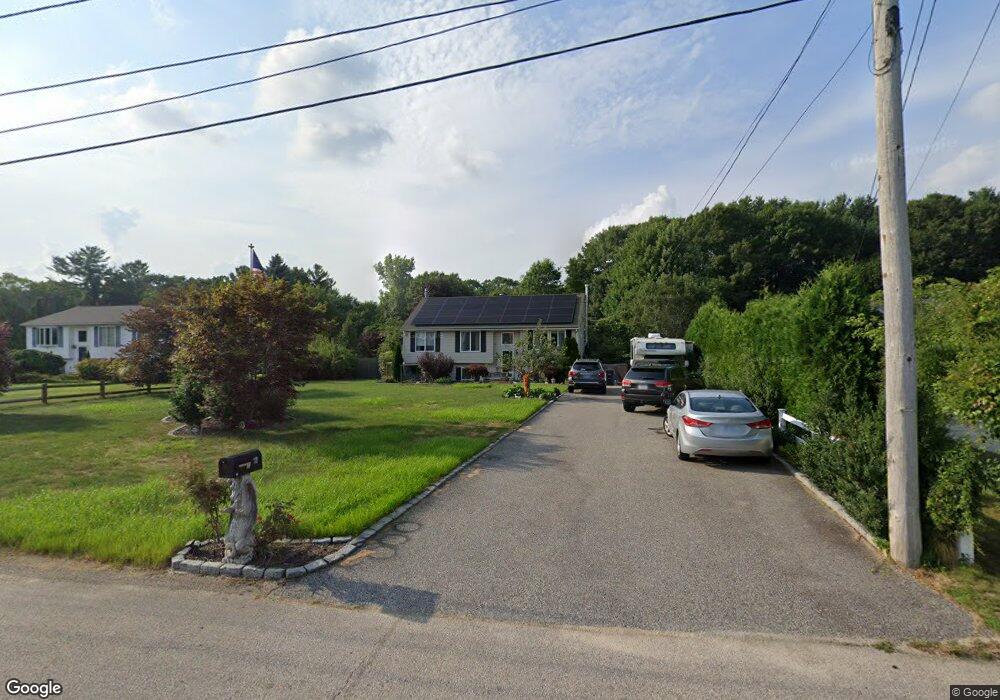
32 King St Coventry, RI 02816
Estimated Value: $414,000 - $509,407
3
Beds
2
Baths
1,932
Sq Ft
$239/Sq Ft
Est. Value
About This Home
This home is located at 32 King St, Coventry, RI 02816 and is currently estimated at $461,602, approximately $238 per square foot. 32 King St is a home located in Kent County with nearby schools including Alan Shawn Feinstein Ms Of Cov, Coventry High School, and Father John V. Doyle School.
Ownership History
Date
Name
Owned For
Owner Type
Purchase Details
Closed on
Apr 13, 2016
Sold by
Hagopian Debra P and Parrillo Marie
Bought by
Brown Debra P
Current Estimated Value
Home Financials for this Owner
Home Financials are based on the most recent Mortgage that was taken out on this home.
Original Mortgage
$181,691
Outstanding Balance
$144,153
Interest Rate
3.64%
Mortgage Type
New Conventional
Estimated Equity
$317,449
Purchase Details
Closed on
Aug 23, 2011
Sold by
Hagopian David J and Parrillo-Hagopian Debra
Bought by
Parrillo-Hagopian Debra
Home Financials for this Owner
Home Financials are based on the most recent Mortgage that was taken out on this home.
Original Mortgage
$184,000
Interest Rate
4.62%
Purchase Details
Closed on
Oct 16, 2002
Sold by
Barcia Miguel and Barcia Brenda J
Bought by
Hagopian David J
Purchase Details
Closed on
Jun 19, 1996
Sold by
Superior Prop Inc
Bought by
Barcia Miguel and Barcia Brenda
Create a Home Valuation Report for This Property
The Home Valuation Report is an in-depth analysis detailing your home's value as well as a comparison with similar homes in the area
Home Values in the Area
Average Home Value in this Area
Purchase History
| Date | Buyer | Sale Price | Title Company |
|---|---|---|---|
| Brown Debra P | -- | -- | |
| Parrillo-Hagopian Debra | -- | -- | |
| Hagopian David J | $245,000 | -- | |
| Barcia Miguel | $120,500 | -- |
Source: Public Records
Mortgage History
| Date | Status | Borrower | Loan Amount |
|---|---|---|---|
| Open | Barcia Miguel | $181,691 | |
| Previous Owner | Barcia Miguel | $5,000 | |
| Previous Owner | Barcia Miguel | $184,000 |
Source: Public Records
Tax History Compared to Growth
Tax History
| Year | Tax Paid | Tax Assessment Tax Assessment Total Assessment is a certain percentage of the fair market value that is determined by local assessors to be the total taxable value of land and additions on the property. | Land | Improvement |
|---|---|---|---|---|
| 2024 | $5,953 | $375,800 | $156,000 | $219,800 |
| 2023 | $5,761 | $375,800 | $156,000 | $219,800 |
| 2022 | $5,851 | $299,000 | $147,700 | $151,300 |
| 2021 | $5,801 | $299,000 | $147,700 | $151,300 |
| 2020 | $6,650 | $299,000 | $147,700 | $151,300 |
| 2019 | $5,702 | $256,400 | $119,400 | $137,000 |
| 2018 | $5,541 | $256,400 | $119,400 | $137,000 |
| 2017 | $5,379 | $256,400 | $119,400 | $137,000 |
| 2016 | $5,438 | $254,000 | $130,800 | $123,200 |
| 2015 | $5,214 | $250,300 | $130,800 | $119,500 |
| 2014 | $5,105 | $250,300 | $130,800 | $119,500 |
| 2013 | $4,435 | $237,700 | $117,800 | $119,900 |
Source: Public Records
Map
Nearby Homes