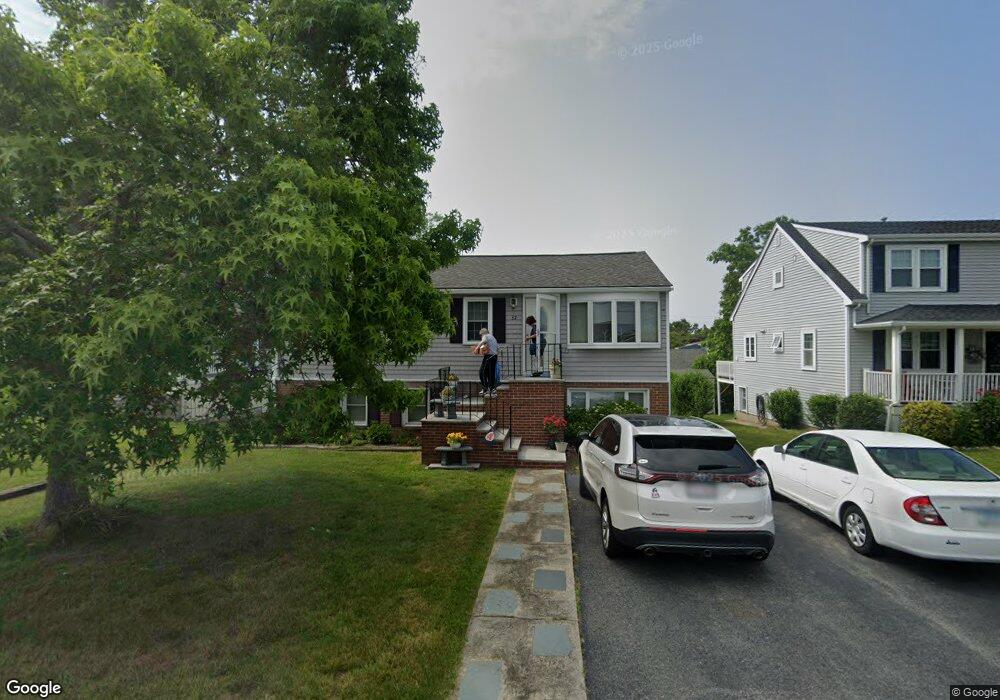
32 Knott Ave Sandwich, MA 02563
Estimated Value: $770,073 - $844,000
4
Beds
2
Baths
1,201
Sq Ft
$671/Sq Ft
Est. Value
About This Home
This home is located at 32 Knott Ave, Sandwich, MA 02563 and is currently estimated at $806,268, approximately $671 per square foot. 32 Knott Ave is a home located in Barnstable County with nearby schools including Sandwich Middle High School, Waldorf School of Cape Cod, and Bridgeview Montessori School.
Ownership History
Date
Name
Owned For
Owner Type
Purchase Details
Closed on
May 24, 1996
Sold by
Greene Brendan E and Greene Ann C
Bought by
Tattersall Dianne M
Current Estimated Value
Home Financials for this Owner
Home Financials are based on the most recent Mortgage that was taken out on this home.
Original Mortgage
$88,900
Outstanding Balance
$5,070
Interest Rate
8.01%
Mortgage Type
Purchase Money Mortgage
Estimated Equity
$801,198
Create a Home Valuation Report for This Property
The Home Valuation Report is an in-depth analysis detailing your home's value as well as a comparison with similar homes in the area
Home Values in the Area
Average Home Value in this Area
Purchase History
| Date | Buyer | Sale Price | Title Company |
|---|---|---|---|
| Tattersall Dianne M | $138,900 | -- |
Source: Public Records
Mortgage History
| Date | Status | Borrower | Loan Amount |
|---|---|---|---|
| Open | Tattersall Dianne M | $88,900 |
Source: Public Records
Tax History Compared to Growth
Tax History
| Year | Tax Paid | Tax Assessment Tax Assessment Total Assessment is a certain percentage of the fair market value that is determined by local assessors to be the total taxable value of land and additions on the property. | Land | Improvement |
|---|---|---|---|---|
| 2025 | $6,365 | $602,200 | $350,400 | $251,800 |
| 2024 | $5,720 | $529,600 | $291,900 | $237,700 |
| 2023 | $5,573 | $484,600 | $265,300 | $219,300 |
| 2022 | $5,136 | $390,300 | $213,200 | $177,100 |
| 2021 | $4,996 | $362,800 | $205,000 | $157,800 |
| 2020 | $4,821 | $336,900 | $187,200 | $149,700 |
| 2019 | $4,620 | $322,600 | $182,000 | $140,600 |
| 2018 | $4,226 | $295,700 | $165,200 | $130,500 |
| 2017 | $4,112 | $275,400 | $153,100 | $122,300 |
| 2016 | $3,916 | $270,600 | $151,500 | $119,100 |
| 2015 | $3,847 | $259,600 | $142,600 | $117,000 |
Source: Public Records
Map
Nearby Homes