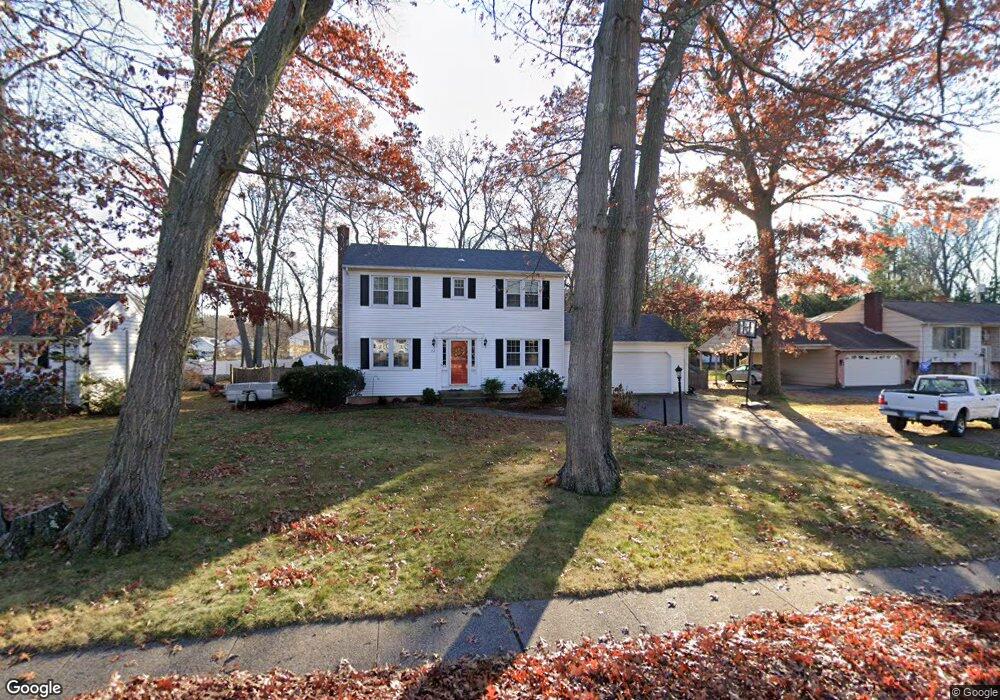
32 Laydon Ave North Haven, CT 06473
Estimated Value: $512,185 - $845,000
4
Beds
7
Baths
1,928
Sq Ft
$322/Sq Ft
Est. Value
About This Home
This home is located at 32 Laydon Ave, North Haven, CT 06473 and is currently estimated at $621,546, approximately $322 per square foot. 32 Laydon Ave is a home located in New Haven County with nearby schools including North Haven Middle School and North Haven High School.
Ownership History
Date
Name
Owned For
Owner Type
Purchase Details
Closed on
Jul 1, 2009
Sold by
Wydra Thomas J and Wydra Mindi B M
Bought by
Bryson Gary and Bryson Lisa
Current Estimated Value
Home Financials for this Owner
Home Financials are based on the most recent Mortgage that was taken out on this home.
Original Mortgage
$210,000
Interest Rate
4.86%
Purchase Details
Closed on
Jan 10, 2000
Sold by
Burns John P and Burns Jeralyn
Bought by
Wydra Thomas J and Mulhern Mindi B
Home Financials for this Owner
Home Financials are based on the most recent Mortgage that was taken out on this home.
Original Mortgage
$163,200
Interest Rate
7.73%
Purchase Details
Closed on
Nov 23, 1998
Sold by
Glynn James F and Glynn Marie A
Bought by
Burns John P and Burns Jeralyn
Home Financials for this Owner
Home Financials are based on the most recent Mortgage that was taken out on this home.
Original Mortgage
$122,500
Interest Rate
6.49%
Create a Home Valuation Report for This Property
The Home Valuation Report is an in-depth analysis detailing your home's value as well as a comparison with similar homes in the area
Home Values in the Area
Average Home Value in this Area
Purchase History
| Date | Buyer | Sale Price | Title Company |
|---|---|---|---|
| Bryson Gary | $360,000 | -- | |
| Wydra Thomas J | $204,000 | -- | |
| Burns John P | $167,500 | -- |
Source: Public Records
Mortgage History
| Date | Status | Borrower | Loan Amount |
|---|---|---|---|
| Closed | Burns John P | $210,000 | |
| Previous Owner | Burns John P | $151,000 | |
| Previous Owner | Burns John P | $163,200 | |
| Previous Owner | Burns John P | $122,500 |
Source: Public Records
Tax History
| Year | Tax Paid | Tax Assessment Tax Assessment Total Assessment is a certain percentage of the fair market value that is determined by local assessors to be the total taxable value of land and additions on the property. | Land | Improvement |
|---|---|---|---|---|
| 2025 | $8,806 | $298,900 | $76,300 | $222,600 |
| 2024 | $7,504 | $216,640 | $76,300 | $140,340 |
| 2023 | $7,073 | $216,640 | $76,300 | $140,340 |
| 2022 | $6,653 | $216,640 | $76,300 | $140,340 |
| 2021 | $6,653 | $216,640 | $76,300 | $140,340 |
| 2020 | $6,655 | $216,640 | $76,300 | $140,340 |
| 2019 | $6,524 | $209,230 | $72,240 | $136,990 |
| 2018 | $6,524 | $209,230 | $72,240 | $136,990 |
| 2017 | $6,398 | $209,230 | $72,240 | $136,990 |
| 2016 | $6,388 | $209,230 | $72,240 | $136,990 |
| 2015 | $6,156 | $209,230 | $72,240 | $136,990 |
| 2014 | $6,149 | $218,820 | $86,800 | $132,020 |
Source: Public Records
Map
Nearby Homes
- 10 Ball Rd
- 137 Mulholland Way Unit 83
- 6 Waterbury Rd
- 140 Shawmut Ave
- 24 North Ave
- 63 Sackett Point Rd
- 38 Pine River Rd
- 511 Elm St Unit 3-2
- 101 Pool Rd
- 10 Hemingway Rd
- 471 Quinnipiac Ave
- 71 Leonardo Dr
- 26 Susan Ln
- 201 Rimmon Rd
- 16 Fieldstone Ct
- 22 Fieldstone Ct Unit 22
- 50 Bassett Rd
- 7 Old Forge Rd
- 146 Fitch St
- 150 Rimmon Rd
Your Personal Tour Guide
Ask me questions while you tour the home.