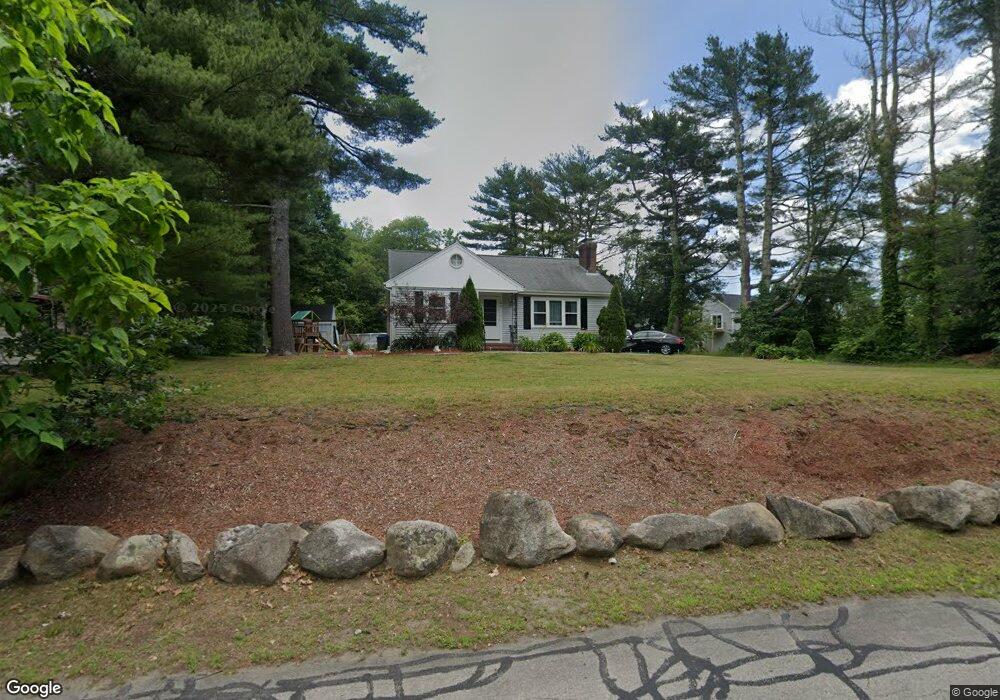
32 Leboeuf St New Bedford, MA 02745
Estimated Value: $418,000 - $556,000
3
Beds
1
Bath
1,737
Sq Ft
$276/Sq Ft
Est. Value
About This Home
This home is located at 32 Leboeuf St, New Bedford, MA 02745 and is currently estimated at $479,352, approximately $275 per square foot. 32 Leboeuf St is a home located in Bristol County with nearby schools including Elwyn G. Campbell Elementary school, Normandin Middle School, and New Bedford High School.
Ownership History
Date
Name
Owned For
Owner Type
Purchase Details
Closed on
Sep 9, 2025
Sold by
Castonguay Kim A
Bought by
Castonguay Kim A and Cabral Melissa
Current Estimated Value
Purchase Details
Closed on
Jul 23, 2025
Sold by
Castonguay Kim A
Bought by
Castonguay Kim A
Purchase Details
Closed on
Apr 23, 2019
Sold by
Castonguay Kim A
Bought by
Castonguay Kim A and Cabral David
Purchase Details
Closed on
Oct 22, 2010
Sold by
Usa Va
Bought by
Castonguay Mark S and Cabral Kim A
Home Financials for this Owner
Home Financials are based on the most recent Mortgage that was taken out on this home.
Original Mortgage
$187,475
Interest Rate
4.37%
Mortgage Type
Purchase Money Mortgage
Purchase Details
Closed on
Jun 18, 2010
Sold by
Walsh Justin S
Bought by
Usa Va
Purchase Details
Closed on
Sep 9, 2005
Sold by
Chagnon Joanne and Chagnon Richard
Bought by
Walsh Justin S
Home Financials for this Owner
Home Financials are based on the most recent Mortgage that was taken out on this home.
Original Mortgage
$265,590
Interest Rate
5.79%
Mortgage Type
VA
Purchase Details
Closed on
Apr 14, 2005
Sold by
Pelczar Irene D Est
Bought by
Chagnon Joanne and Chagnon Richard
Create a Home Valuation Report for This Property
The Home Valuation Report is an in-depth analysis detailing your home's value as well as a comparison with similar homes in the area
Home Values in the Area
Average Home Value in this Area
Purchase History
| Date | Buyer | Sale Price | Title Company |
|---|---|---|---|
| Castonguay Kim A | -- | -- | |
| Castonguay Kim A | -- | -- | |
| Castonguay Kim A | -- | -- | |
| Castonguay Kim A | -- | -- | |
| Castonguay Kim A | -- | -- | |
| Castonguay Kim A | -- | -- | |
| Castonguay Mark S | $190,000 | -- | |
| Castonguay Mark S | $190,000 | -- | |
| Usa Va | $149,821 | -- | |
| Usa Va | $149,821 | -- | |
| Walsh Justin S | $260,000 | -- | |
| Walsh Justin S | $260,000 | -- | |
| Chagnon Joanne | $99,000 | -- | |
| Chagnon Joanne | $99,000 | -- |
Source: Public Records
Mortgage History
| Date | Status | Borrower | Loan Amount |
|---|---|---|---|
| Previous Owner | Chagnon Joanne | $187,475 | |
| Previous Owner | Chagnon Joanne | $265,590 |
Source: Public Records
Tax History Compared to Growth
Tax History
| Year | Tax Paid | Tax Assessment Tax Assessment Total Assessment is a certain percentage of the fair market value that is determined by local assessors to be the total taxable value of land and additions on the property. | Land | Improvement |
|---|---|---|---|---|
| 2025 | $5,129 | $453,500 | $171,900 | $281,600 |
| 2024 | $4,144 | $345,300 | $119,400 | $225,900 |
| 2023 | $4,194 | $293,500 | $99,300 | $194,200 |
| 2022 | $3,812 | $245,300 | $90,700 | $154,600 |
| 2021 | $3,734 | $239,500 | $90,700 | $148,800 |
| 2020 | $3,626 | $224,400 | $93,100 | $131,300 |
| 2019 | $3,493 | $212,100 | $93,100 | $119,000 |
| 2018 | $3,324 | $199,900 | $95,500 | $104,400 |
| 2017 | $3,158 | $189,200 | $95,500 | $93,700 |
| 2016 | $3,026 | $183,500 | $95,500 | $88,000 |
| 2015 | $2,828 | $179,800 | $95,500 | $84,300 |
| 2014 | $2,771 | $182,800 | $100,300 | $82,500 |
Source: Public Records
Map
Nearby Homes
- 0 Hammond St
- 15 Cox St
- 683 Church St
- 398 Brockton St
- 362 Prescott St
- 506 Hawes St
- 424 Church St
- 98 Seabury St
- 1164 Victoria St
- 1158 Joyce St
- 447 Wood St
- 362 Tarkiln Hill Rd
- 209 Jarry St
- 1214 Church St
- 223 225 Prinston
- 11 Moynan St
- 1261 Church St Unit 70
- 1261 Church St Unit 46
- 1261 Church St Unit 53
- 0 Church Dutton & Chaffee Unit 73371719
- 42 Leboeuf St
- 1141 Old Plainville Rd
- 1123 Old Plainville Rd
- 15 Leboeuf St
- 7 Leboeuf St
- 1115 Old Plainville Rd
- 1169 Old Plainville Rd
- 1146 Old Plainville Rd
- 1128 Old Plainville Rd
- 1187 Old Plainville Rd
- 1172 Old Plainville Rd
- 1195 Old Plainville Rd
- 1196 Old Plainville Rd
- 174 Old Plainville Rd
- 172 Old Plainville Rd
- 1207 Old Plainville Rd
- 1210 Old Plainville Rd
- 1194 Old Plainville Rd
- 1225 Old Plainville Rd
- 1227 Old Plainville Rd