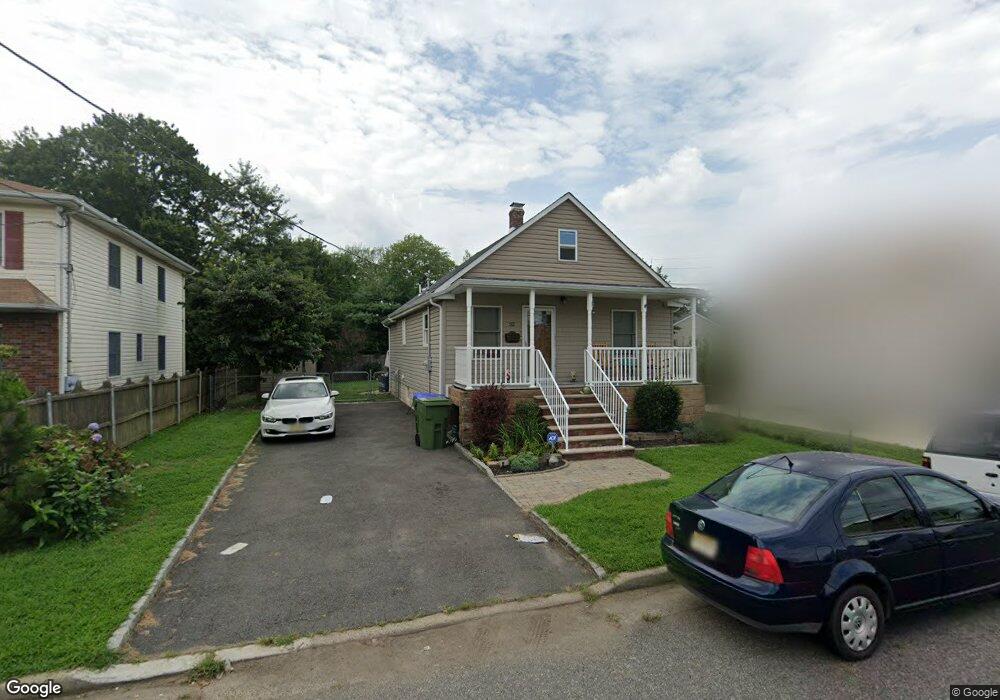
32 Loring Ave Edison, NJ 08817
Estimated Value: $432,000 - $518,000
2
Beds
2
Baths
936
Sq Ft
$495/Sq Ft
Est. Value
About This Home
This home is located at 32 Loring Ave, Edison, NJ 08817 and is currently estimated at $463,395, approximately $495 per square foot. 32 Loring Ave is a home located in Middlesex County with nearby schools including Lindeneau Elementary School, Thomas Jefferson Middle School, and Edison High School.
Ownership History
Date
Name
Owned For
Owner Type
Purchase Details
Closed on
Aug 11, 2015
Sold by
Young Christopher T and Young Bethany J
Bought by
Cardona Nataly
Current Estimated Value
Purchase Details
Closed on
Feb 22, 2006
Sold by
Ell Capital Llc
Bought by
Young Christopher
Home Financials for this Owner
Home Financials are based on the most recent Mortgage that was taken out on this home.
Original Mortgage
$225,000
Interest Rate
6.16%
Purchase Details
Closed on
Oct 5, 2005
Sold by
Clark William
Bought by
Ell Capital Llc
Create a Home Valuation Report for This Property
The Home Valuation Report is an in-depth analysis detailing your home's value as well as a comparison with similar homes in the area
Home Values in the Area
Average Home Value in this Area
Purchase History
| Date | Buyer | Sale Price | Title Company |
|---|---|---|---|
| Cardona Nataly | $240,000 | None Available | |
| Young Christopher | $281,400 | -- | |
| Ell Capital Llc | $225,000 | -- |
Source: Public Records
Mortgage History
| Date | Status | Borrower | Loan Amount |
|---|---|---|---|
| Previous Owner | Young Christopher | $225,000 |
Source: Public Records
Tax History
| Year | Tax Paid | Tax Assessment Tax Assessment Total Assessment is a certain percentage of the fair market value that is determined by local assessors to be the total taxable value of land and additions on the property. | Land | Improvement |
|---|---|---|---|---|
| 2025 | $6,727 | $113,000 | $70,000 | $43,000 |
| 2024 | $6,691 | $113,000 | $70,000 | $43,000 |
Source: Public Records
Map
Nearby Homes
- 45 Loring Ave
- 59 Oakland Ave
- 23 Morse Ave
- 58 Fern St
- 89 Hickory St
- 65 Orange St
- 226 Wellington Place
- 12 Old Post Rd
- 102 Keystone Ct
- 61 Duley Ave
- 66 Garden Terrace
- 7 Vale St
- 47 Hillcrest Ave
- 1711 Central Ave
- 225 Penn Ave
- 14 York Dr Unit 4B
- 6 York Dr Unit 5A
- 223 Plainfield Ave
- 15 York Dr Unit 2A
- 15 York Dr Unit 1B
Your Personal Tour Guide
Ask me questions while you tour the home.