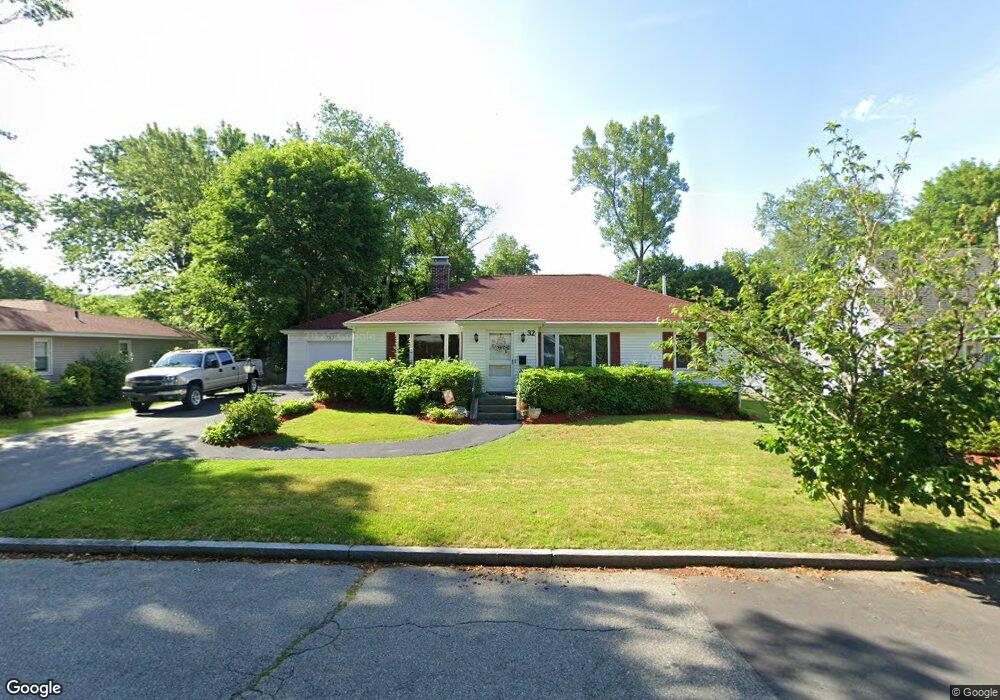
32 Mabelle St Worcester, MA 01602
Salisbury Street NeighborhoodEstimated Value: $451,638 - $547,000
3
Beds
3
Baths
1,386
Sq Ft
$353/Sq Ft
Est. Value
About This Home
This home is located at 32 Mabelle St, Worcester, MA 01602 and is currently estimated at $488,910, approximately $352 per square foot. 32 Mabelle St is a home located in Worcester County with nearby schools including Chandler Magnet, Jacob Hiatt Magnet School, and Midland Street.
Ownership History
Date
Name
Owned For
Owner Type
Purchase Details
Closed on
Oct 29, 1999
Sold by
Pozniakov David and Pozniakov Ludmila
Bought by
Martin Steven J and Martin Susan L
Current Estimated Value
Home Financials for this Owner
Home Financials are based on the most recent Mortgage that was taken out on this home.
Original Mortgage
$24,000
Outstanding Balance
$7,288
Interest Rate
7.68%
Estimated Equity
$481,622
Create a Home Valuation Report for This Property
The Home Valuation Report is an in-depth analysis detailing your home's value as well as a comparison with similar homes in the area
Home Values in the Area
Average Home Value in this Area
Purchase History
| Date | Buyer | Sale Price | Title Company |
|---|---|---|---|
| Martin Steven J | $180,000 | -- |
Source: Public Records
Mortgage History
| Date | Status | Borrower | Loan Amount |
|---|---|---|---|
| Open | Martin Steven J | $24,000 | |
| Open | Martin Steven J | $120,000 | |
| Previous Owner | Martin Steven J | $40,000 | |
| Previous Owner | Martin Steven J | $103,000 |
Source: Public Records
Tax History
| Year | Tax Paid | Tax Assessment Tax Assessment Total Assessment is a certain percentage of the fair market value that is determined by local assessors to be the total taxable value of land and additions on the property. | Land | Improvement |
|---|---|---|---|---|
| 2025 | $4,950 | $375,300 | $119,000 | $256,300 |
| 2024 | $4,850 | $352,700 | $119,000 | $233,700 |
| 2023 | $4,692 | $327,200 | $103,500 | $223,700 |
| 2022 | $4,166 | $273,900 | $82,800 | $191,100 |
| 2021 | $4,147 | $254,700 | $66,200 | $188,500 |
| 2020 | $3,985 | $234,400 | $66,200 | $168,200 |
| 2019 | $3,753 | $208,500 | $59,700 | $148,800 |
| 2018 | $3,646 | $192,800 | $59,700 | $133,100 |
| 2017 | $3,706 | $192,800 | $59,700 | $133,100 |
| 2016 | $3,642 | $176,700 | $44,500 | $132,200 |
| 2015 | $3,546 | $176,700 | $44,500 | $132,200 |
| 2014 | $3,763 | $192,600 | $44,500 | $148,100 |
Source: Public Records
Map
Nearby Homes
Your Personal Tour Guide
Ask me questions while you tour the home.