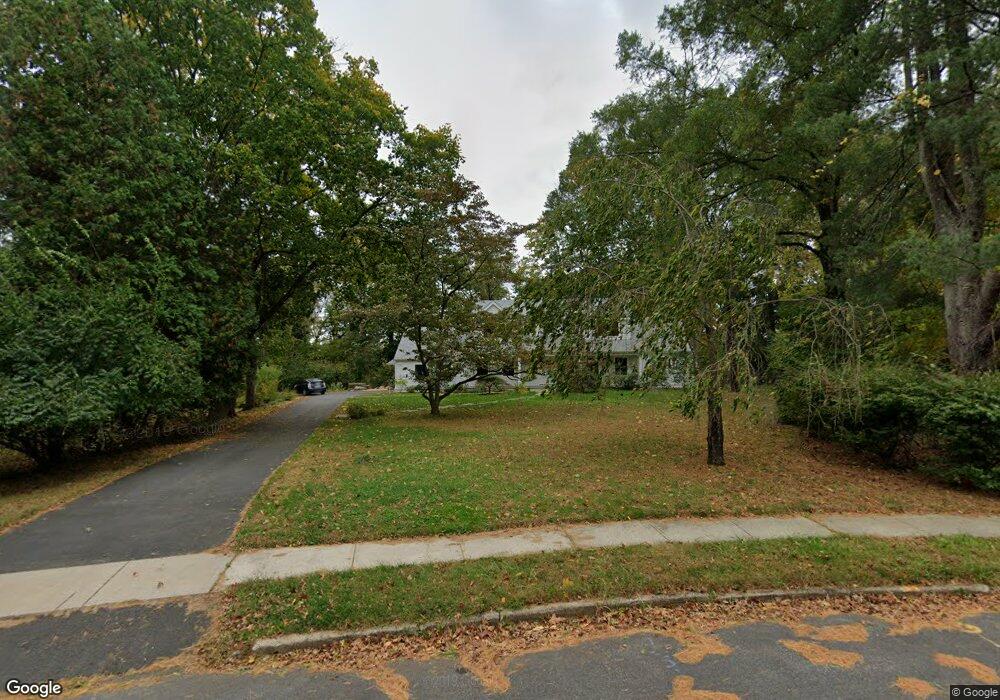
32 Maclean Cir Princeton, NJ 08540
Estimated Value: $1,623,000 - $1,933,000
--
Bed
--
Bath
2,900
Sq Ft
$594/Sq Ft
Est. Value
About This Home
This home is located at 32 Maclean Cir, Princeton, NJ 08540 and is currently estimated at $1,722,075, approximately $593 per square foot. 32 Maclean Cir is a home located in Mercer County with nearby schools including Riverside Elementary School, Princeton Middle School, and Princeton High School.
Ownership History
Date
Name
Owned For
Owner Type
Purchase Details
Closed on
May 28, 2025
Sold by
Porporato Amilcare and Ward Tracy C
Bought by
Trustees Of Princeton University
Current Estimated Value
Purchase Details
Closed on
Oct 27, 2017
Sold by
The Trustees Of Princeton University
Bought by
Porporato Amilcare
Home Financials for this Owner
Home Financials are based on the most recent Mortgage that was taken out on this home.
Original Mortgage
$700,000
Interest Rate
3.83%
Mortgage Type
Purchase Money Mortgage
Purchase Details
Closed on
Feb 26, 2015
Sold by
Li Kai
Bought by
The Trustees Of Princeton University
Purchase Details
Closed on
Jul 31, 2009
Sold by
Li Kai and Wang Haishu
Bought by
Li Kai
Purchase Details
Closed on
Jul 12, 1996
Sold by
Trustees Princeton Univ
Bought by
Li Kai and Wang Haishu
Home Financials for this Owner
Home Financials are based on the most recent Mortgage that was taken out on this home.
Original Mortgage
$329,000
Interest Rate
8.28%
Create a Home Valuation Report for This Property
The Home Valuation Report is an in-depth analysis detailing your home's value as well as a comparison with similar homes in the area
Home Values in the Area
Average Home Value in this Area
Purchase History
| Date | Buyer | Sale Price | Title Company |
|---|---|---|---|
| Trustees Of Princeton University | $1,868,000 | First American Title | |
| Trustees Of Princeton University | $1,868,000 | First American Title | |
| Porporato Amilcare | $1,200,000 | Empire Title & Abstract Agen | |
| The Trustees Of Princeton University | $1,025,000 | None Available | |
| Li Kai | -- | None Available | |
| Li Kai | $386,686 | -- |
Source: Public Records
Mortgage History
| Date | Status | Borrower | Loan Amount |
|---|---|---|---|
| Previous Owner | Porporato Amilcare | $700,000 | |
| Previous Owner | Li Kai | $329,000 |
Source: Public Records
Tax History Compared to Growth
Tax History
| Year | Tax Paid | Tax Assessment Tax Assessment Total Assessment is a certain percentage of the fair market value that is determined by local assessors to be the total taxable value of land and additions on the property. | Land | Improvement |
|---|---|---|---|---|
| 2025 | $24,010 | $901,600 | $543,500 | $358,100 |
| 2024 | $22,666 | $901,600 | $543,500 | $358,100 |
| 2023 | $22,666 | $901,600 | $543,500 | $358,100 |
| 2022 | $21,927 | $901,600 | $543,500 | $358,100 |
| 2021 | $21,990 | $901,600 | $543,500 | $358,100 |
| 2020 | $21,819 | $901,600 | $543,500 | $358,100 |
| 2019 | $21,386 | $901,600 | $543,500 | $358,100 |
| 2018 | $21,025 | $901,600 | $543,500 | $358,100 |
| 2017 | $18,550 | $806,500 | $543,500 | $263,000 |
| 2016 | $18,259 | $806,500 | $543,500 | $263,000 |
| 2015 | $16,486 | $745,300 | $496,000 | $249,300 |
| 2014 | $16,285 | $745,300 | $496,000 | $249,300 |
Source: Public Records
Map
Nearby Homes
- 38 Maclean Cir
- 24 Maclean Cir
- 27 Maclean Cir
- 27 Maclean Cir
- 44 Maclean Cir
- 16 Maclean Cir
- 11 Maclean Cir
- 11 Maclean Cir
- 54 Maclean Cir
- 47 Maclean Cir
- 10 Maclean Cir
- 307 Hartley Ave
- 64 Maclean Cir
- 59 Maclean Cir
- 478 Lake Dr
- 293 Hartley Ave
- 74 Maclean Cir
- 189 Longview Dr
- 199 Longview Dr
- 302 Hartley Ave